| Red | Green | Blue | |
| z | 17.64 | ||
| znorm | Inf | ||
| sky | -NaN | -Inf | -NaN |
| S/N | 17.0 | 31.0 | 33.1 |
| S/N(c) | 0.0 | 0.0 | 0.0 |
| SN(E/C) |
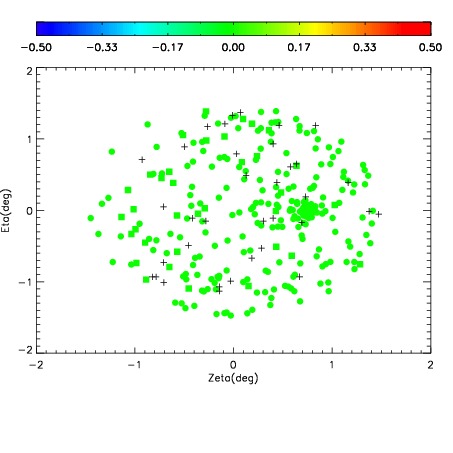

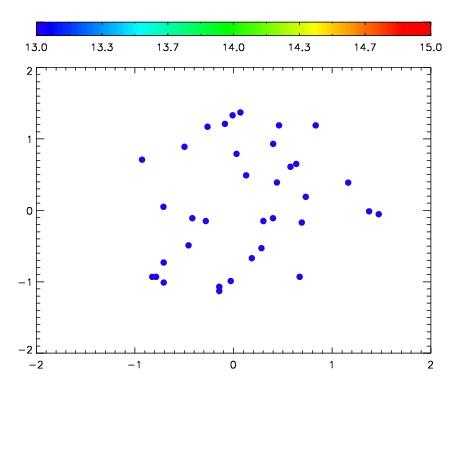

| Frame | Nreads | Zeropoints | Mag plots | Spatial mag deviation | Spatial sky 16325A emission deviations (filled: sky, open: star) | Spatial sky continuum emission | Spatial sky telluric CO2 absorption deviations (filled: H < 10) | |||||||||||||||||||||||
| 0 | 0 |
|
|
|
|
|
|
| IPAIR | NAME | SHIFT | NEWSHIFT | S/N | NAME | SHIFT | NEWSHIFT | S/N |
| 0 | 12870006 | 0.476293 | 0.00000 | 18.8274 | 12870008 | -0.00501936 | 0.481312 | 18.7210 |
| 1 | 12870005 | 0.475486 | 0.000806987 | 18.8910 | 12870004 | 0.00000 | 0.476293 | 18.8603 |
| 2 | 12870009 | 0.473825 | 0.00246799 | 18.7024 | 12870007 | -0.00532174 | 0.481615 | 18.7086 |
| 3 | 12870010 | 0.475287 | 0.00100601 | 18.4426 | 12870011 | -0.00165582 | 0.477949 | 18.6143 |