| Red | Green | Blue | |
| z | 17.64 | ||
| znorm | Inf | ||
| sky | -Inf | -Inf | -Inf |
| S/N | 22.0 | 36.0 | 39.3 |
| S/N(c) | 0.0 | 0.0 | 0.0 |
| SN(E/C) |
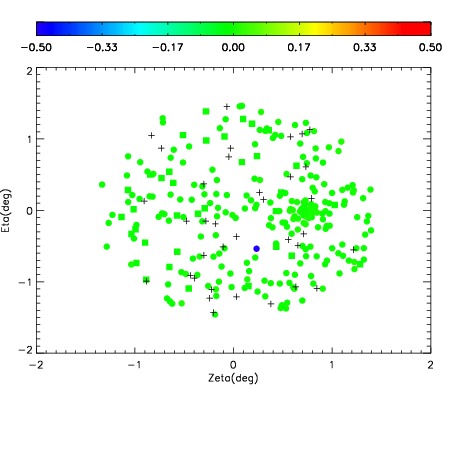
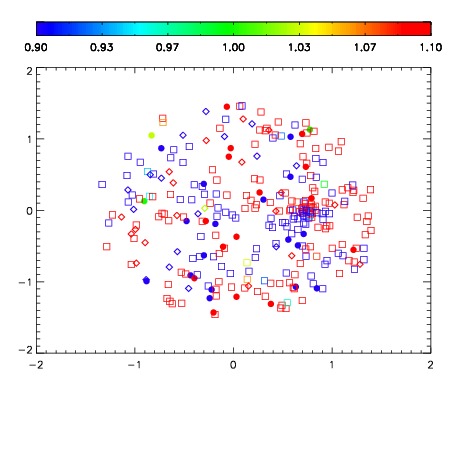
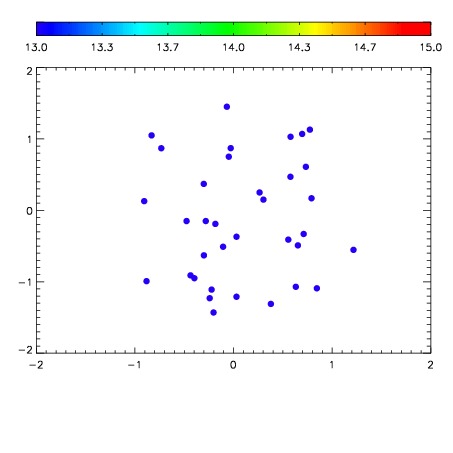

| Frame | Nreads | Zeropoints | Mag plots | Spatial mag deviation | Spatial sky 16325A emission deviations (filled: sky, open: star) | Spatial sky continuum emission | Spatial sky telluric CO2 absorption deviations (filled: H < 10) | |||||||||||||||||||||||
| 0 | 0 |
|
|
|
|
|
|
| IPAIR | NAME | SHIFT | NEWSHIFT | S/N | NAME | SHIFT | NEWSHIFT | S/N |
| 0 | 12340016 | 0.490682 | 0.00000 | 19.0131 | 12340015 | -0.00535080 | 0.496033 | 18.9767 |
| 1 | 12340012 | 0.489026 | 0.00165600 | 18.8787 | 12340014 | -0.00554430 | 0.496226 | 18.8875 |
| 2 | 12340013 | 0.488978 | 0.00170401 | 18.8468 | 12340011 | 0.00000 | 0.490682 | 18.7469 |