| Red | Green | Blue | |
| z | 17.64 | ||
| znorm | Inf | ||
| sky | -Inf | -NaN | -Inf |
| S/N | 10.6 | 15.9 | 19.2 |
| S/N(c) | 0.0 | 0.0 | 0.0 |
| SN(E/C) |


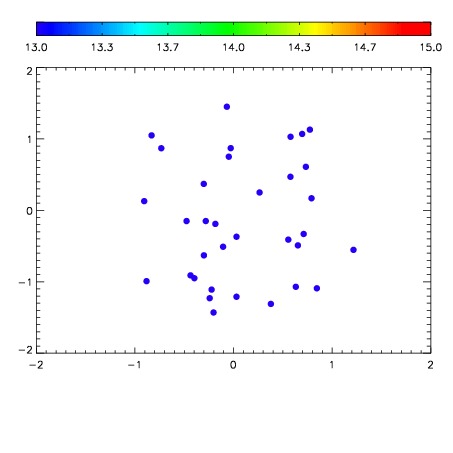

| Frame | Nreads | Zeropoints | Mag plots | Spatial mag deviation | Spatial sky 16325A emission deviations (filled: sky, open: star) | Spatial sky continuum emission | Spatial sky telluric CO2 absorption deviations (filled: H < 10) | |||||||||||||||||||||||
| 0 | 0 |
|
|
|
|
|
|
| IPAIR | NAME | SHIFT | NEWSHIFT | S/N | NAME | SHIFT | NEWSHIFT | S/N |
| 0 | 12570028 | 0.480929 | 0.00000 | 17.4301 | 12570029 | -0.00202335 | 0.482952 | 17.4308 |
| 1 | 12570023 | 0.479297 | 0.00163198 | 18.3010 | 12570026 | -0.00394014 | 0.484869 | 18.2483 |
| 2 | 12570027 | 0.478253 | 0.00267598 | 18.2969 | 12570022 | 0.00000 | 0.480929 | 17.9090 |
| 3 | 12570024 | 0.479418 | 0.00151098 | 17.8129 | 12570025 | -0.00331838 | 0.484247 | 17.9083 |