| Red | Green | Blue | |
| z | 17.64 | ||
| znorm | Inf | ||
| sky | -Inf | -Inf | -Inf |
| S/N | 25.5 | 42.7 | 46.5 |
| S/N(c) | 0.0 | 0.0 | 0.0 |
| SN(E/C) |
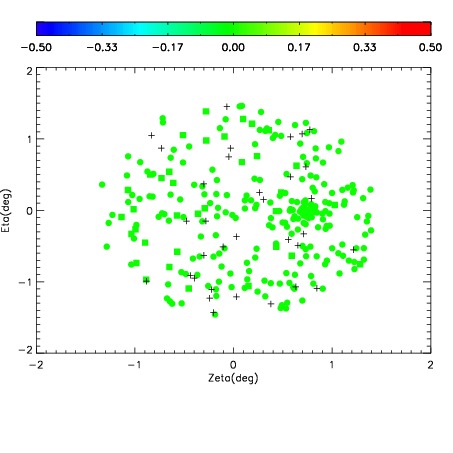
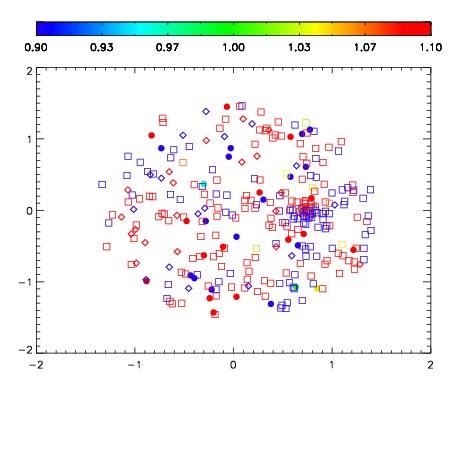
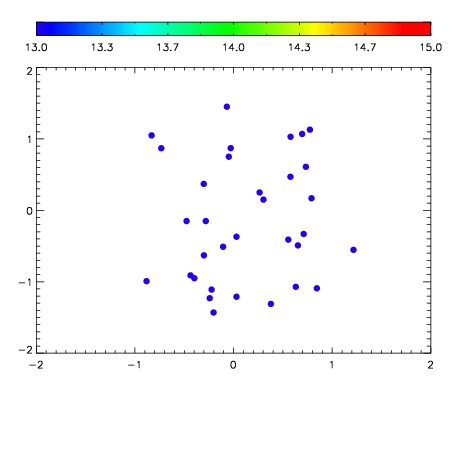

| Frame | Nreads | Zeropoints | Mag plots | Spatial mag deviation | Spatial sky 16325A emission deviations (filled: sky, open: star) | Spatial sky continuum emission | Spatial sky telluric CO2 absorption deviations (filled: H < 10) | |||||||||||||||||||||||
| 0 | 0 |
|
|
|
|
|
|
| IPAIR | NAME | SHIFT | NEWSHIFT | S/N | NAME | SHIFT | NEWSHIFT | S/N |
| 0 | 12740027 | 0.483659 | 0.00000 | 18.9442 | 12740028 | -0.00167755 | 0.485337 | 18.9795 |
| 1 | 12740026 | 0.482215 | 0.00144401 | 18.8883 | 12740025 | -0.00472475 | 0.488384 | 18.9181 |
| 2 | 12740023 | 0.483427 | 0.000232011 | 18.8044 | 12740024 | -0.00484353 | 0.488503 | 18.8668 |
| 3 | 12740022 | 0.483122 | 0.000537008 | 18.7547 | 12740021 | 0.00000 | 0.483659 | 18.6697 |