| Red | Green | Blue | |
| z | 17.63 | ||
| znorm | Inf | ||
| sky | -Inf | -NaN | -Inf |
| S/N | 4.7 | 7.3 | 8.4 |
| S/N(c) | 0.0 | 0.0 | 0.0 |
| SN(E/C) |
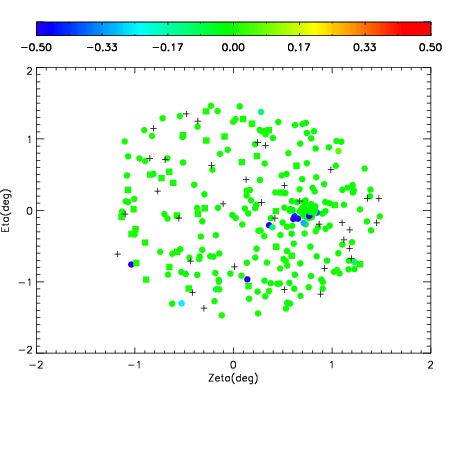
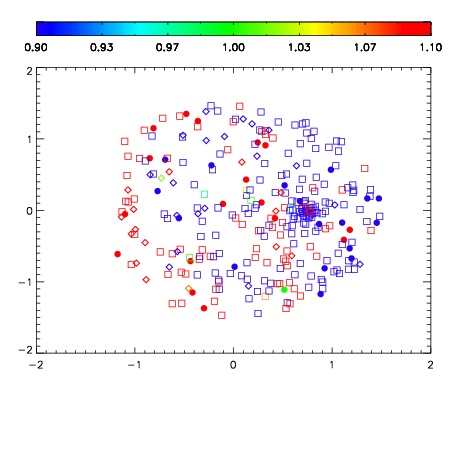
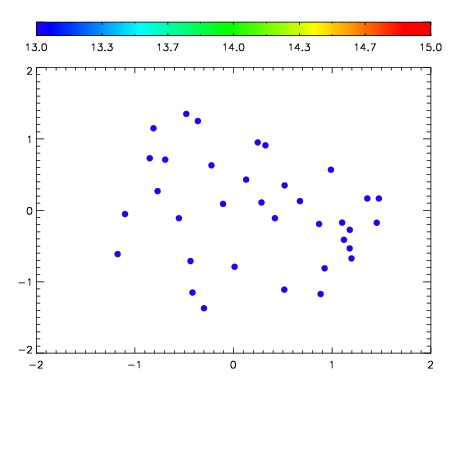

| Frame | Nreads | Zeropoints | Mag plots | Spatial mag deviation | Spatial sky 16325A emission deviations (filled: sky, open: star) | Spatial sky continuum emission | Spatial sky telluric CO2 absorption deviations (filled: H < 10) | |||||||||||||||||||||||
| 0 | 0 |
|
|
|
|
|
|
| IPAIR | NAME | SHIFT | NEWSHIFT | S/N | NAME | SHIFT | NEWSHIFT | S/N |
| 0 | 12320035 | 0.490605 | 0.00000 | 16.3370 | 12320036 | 0.00185270 | 0.488752 | 16.8455 |
| 1 | 12320039 | 0.488815 | 0.00178999 | 17.1307 | 12320040 | -0.00698501 | 0.497590 | 18.4852 |
| 2 | 12320038 | 0.488374 | 0.00223100 | 16.6740 | 12320037 | 0.00198051 | 0.488624 | 16.8965 |
| 3 | 12320034 | 0.489477 | 0.00112799 | 15.4552 | 12320033 | 0.00000 | 0.490605 | 16.6531 |