| Red | Green | Blue | |
| z | 17.64 | ||
| znorm | Inf | ||
| sky | -Inf | -Inf | -Inf |
| S/N | 20.8 | 36.6 | 40.1 |
| S/N(c) | 0.0 | 0.0 | 0.0 |
| SN(E/C) |
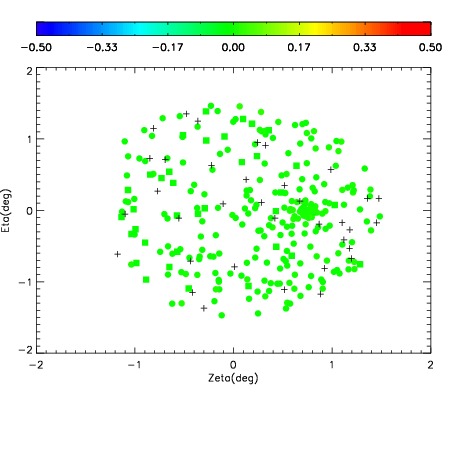
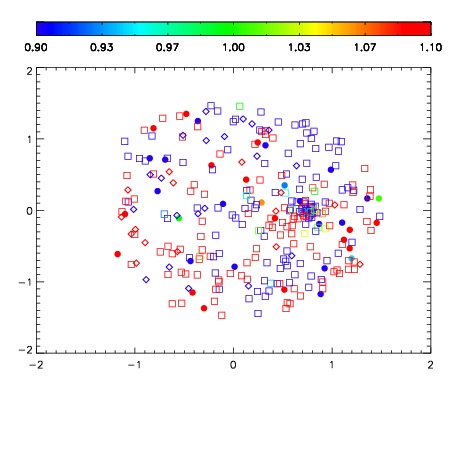
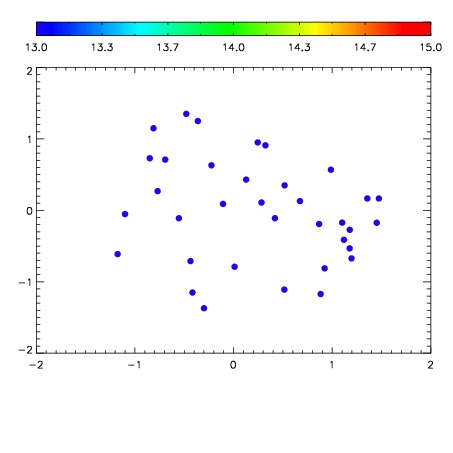

| Frame | Nreads | Zeropoints | Mag plots | Spatial mag deviation | Spatial sky 16325A emission deviations (filled: sky, open: star) | Spatial sky continuum emission | Spatial sky telluric CO2 absorption deviations (filled: H < 10) | |||||||||||||||||||||||
| 0 | 0 |
|
|
|
|
|
|
| IPAIR | NAME | SHIFT | NEWSHIFT | S/N | NAME | SHIFT | NEWSHIFT | S/N |
| 0 | 12520028 | 0.491244 | 0.00000 | 18.7006 | 12520029 | -0.00360900 | 0.494853 | 18.8180 |
| 1 | 12520027 | 0.490545 | 0.000698984 | 18.6839 | 12520026 | 0.00610727 | 0.485137 | 18.8030 |
| 2 | 12520024 | 0.489689 | 0.00155500 | 18.6733 | 12520025 | 0.00622375 | 0.485020 | 18.7873 |
| 3 | 12520023 | 0.489725 | 0.00151899 | 18.6629 | 12520022 | 0.00000 | 0.491244 | 18.5771 |