| Red | Green | Blue | |
| z | 17.64 | ||
| znorm | Inf | ||
| sky | -Inf | -Inf | -Inf |
| S/N | 25.3 | 43.7 | 47.4 |
| S/N(c) | 0.0 | 0.0 | 0.0 |
| SN(E/C) |
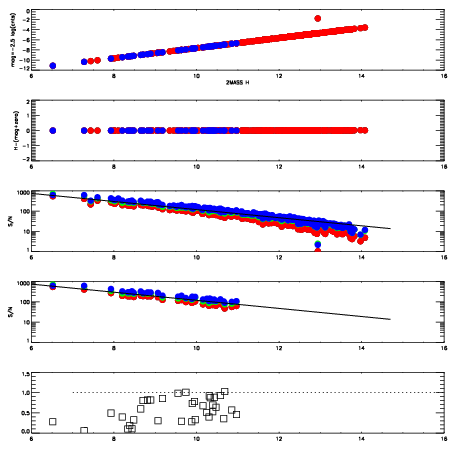
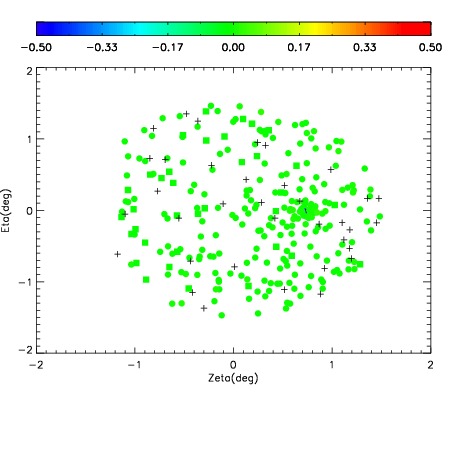
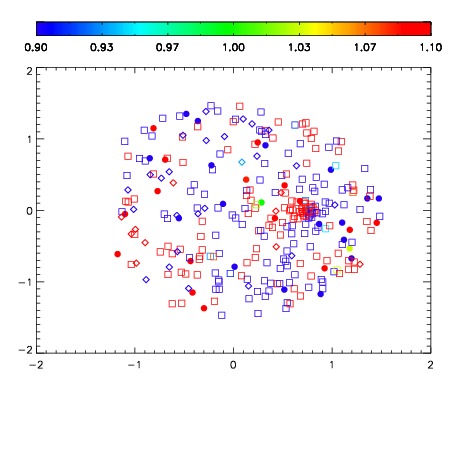
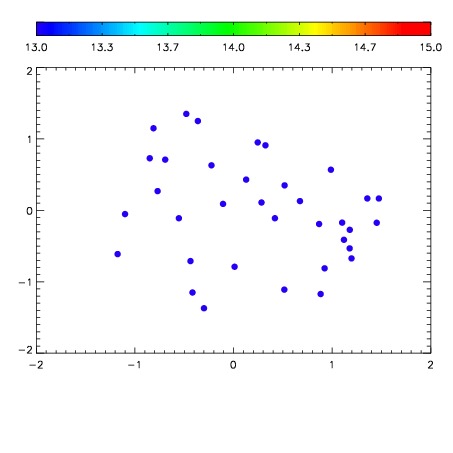

| Frame | Nreads | Zeropoints | Mag plots | Spatial mag deviation | Spatial sky 16325A emission deviations (filled: sky, open: star) | Spatial sky continuum emission | Spatial sky telluric CO2 absorption deviations (filled: H < 10) | |||||||||||||||||||||||
| 0 | 0 |
|
|
|
|
|
|
| IPAIR | NAME | SHIFT | NEWSHIFT | S/N | NAME | SHIFT | NEWSHIFT | S/N |
| 0 | 12560032 | 0.492105 | 0.00000 | 19.0837 | 12560033 | -0.00134735 | 0.493452 | 19.0959 |
| 1 | 12560031 | 0.491680 | 0.000425011 | 19.0609 | 12560030 | -0.00242029 | 0.494525 | 19.0398 |
| 2 | 12560028 | 0.490978 | 0.00112700 | 19.0029 | 12560029 | -0.00260122 | 0.494706 | 19.0394 |
| 3 | 12560027 | 0.491022 | 0.00108302 | 18.9363 | 12560026 | 0.00000 | 0.492105 | 18.9038 |