| Red | Green | Blue | |
| z | 17.64 | ||
| znorm | Inf | ||
| sky | -Inf | -NaN | -Inf |
| S/N | 22.0 | 39.8 | 42.5 |
| S/N(c) | 0.0 | 0.0 | 0.0 |
| SN(E/C) |

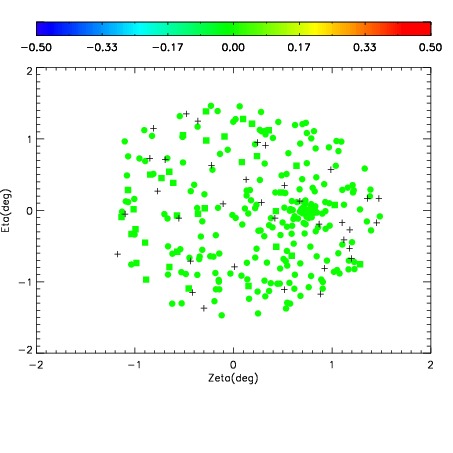
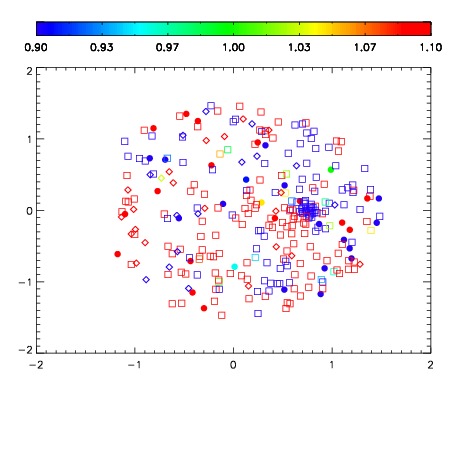
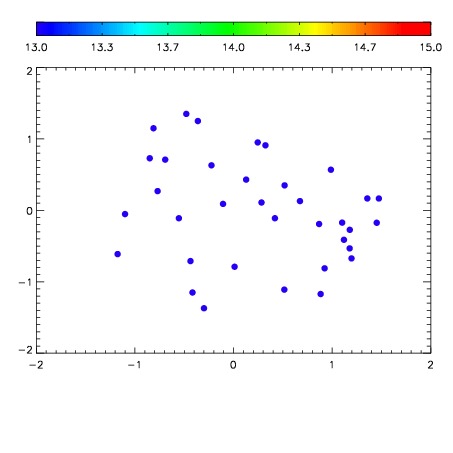

| Frame | Nreads | Zeropoints | Mag plots | Spatial mag deviation | Spatial sky 16325A emission deviations (filled: sky, open: star) | Spatial sky continuum emission | Spatial sky telluric CO2 absorption deviations (filled: H < 10) | |||||||||||||||||||||||
| 0 | 0 |
|
|
|
|
|
|
| IPAIR | NAME | SHIFT | NEWSHIFT | S/N | NAME | SHIFT | NEWSHIFT | S/N |
| 0 | 12730017 | 0.486942 | 0.00000 | 18.9337 | 12730018 | -0.000443206 | 0.487385 | 18.9537 |
| 1 | 12730016 | 0.486509 | 0.000432998 | 18.9108 | 12730015 | -0.00181701 | 0.488759 | 18.8764 |
| 2 | 12730013 | 0.485150 | 0.00179198 | 18.8114 | 12730014 | -0.00182034 | 0.488762 | 18.8071 |
| 3 | 12730012 | 0.482647 | 0.00429499 | 18.7510 | 12730011 | 0.00000 | 0.486942 | 18.6567 |