| Red | Green | Blue | |
| z | 17.64 | ||
| znorm | Inf | ||
| sky | -Inf | -NaN | -Inf |
| S/N | 23.3 | 35.4 | 35.9 |
| S/N(c) | 0.0 | 0.0 | 0.0 |
| SN(E/C) |
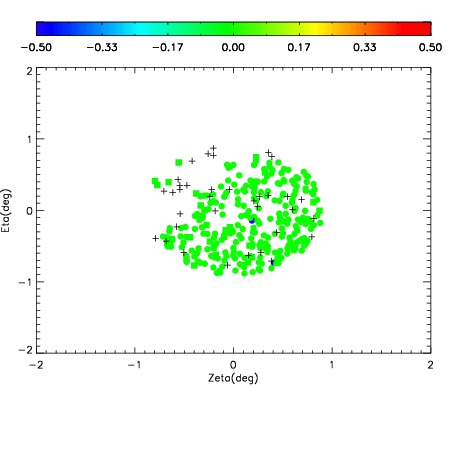
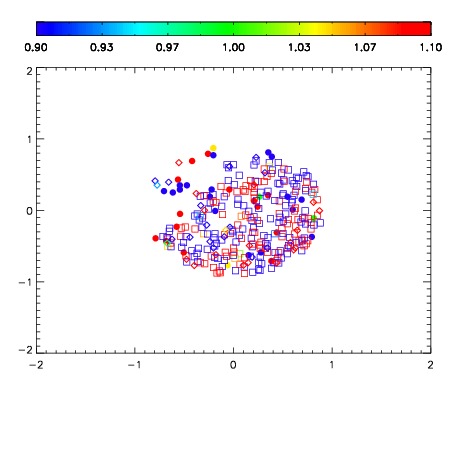
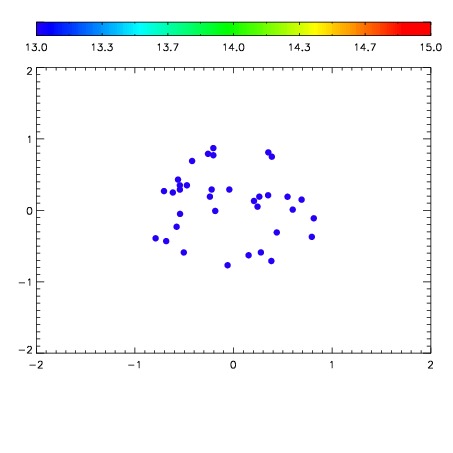

| Frame | Nreads | Zeropoints | Mag plots | Spatial mag deviation | Spatial sky 16325A emission deviations (filled: sky, open: star) | Spatial sky continuum emission | Spatial sky telluric CO2 absorption deviations (filled: H < 10) | |||||||||||||||||||||||
| 0 | 0 |
|
|
|
|
|
|
| IPAIR | NAME | SHIFT | NEWSHIFT | S/N | NAME | SHIFT | NEWSHIFT | S/N |
| 0 | 08990029 | 0.481804 | 0.00000 | 18.4091 | 08990030 | 0.00384558 | 0.477958 | 18.4779 |
| 1 | 08990033 | 0.480583 | 0.00122100 | 18.5971 | 08990034 | 0.00377532 | 0.478029 | 18.5267 |
| 2 | 08990032 | 0.479630 | 0.00217402 | 18.3990 | 08990031 | 0.00279390 | 0.479010 | 18.3994 |
| 3 | 08990028 | 0.481579 | 0.000225008 | 18.2856 | 08990027 | 0.00000 | 0.481804 | 18.2869 |