| Red | Green | Blue | |
| z | 17.64 | ||
| znorm | Inf | ||
| sky | -Inf | -NaN | -Inf |
| S/N | 33.8 | 48.7 | 52.2 |
| S/N(c) | 0.0 | 0.0 | 0.0 |
| SN(E/C) |
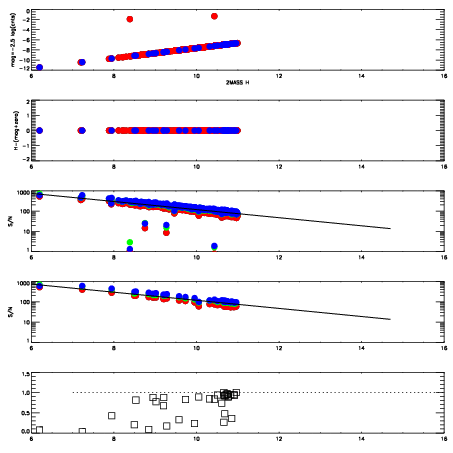
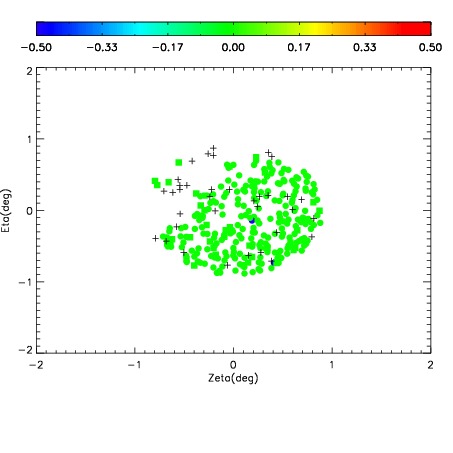
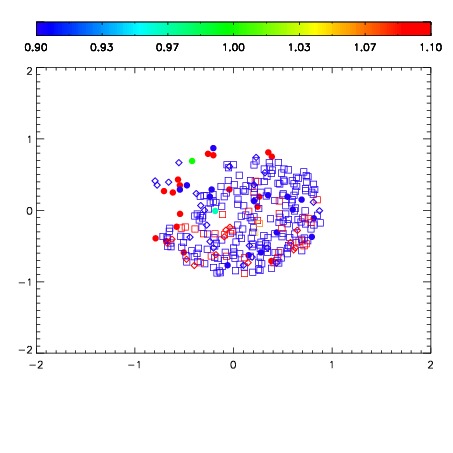


| Frame | Nreads | Zeropoints | Mag plots | Spatial mag deviation | Spatial sky 16325A emission deviations (filled: sky, open: star) | Spatial sky continuum emission | Spatial sky telluric CO2 absorption deviations (filled: H < 10) | |||||||||||||||||||||||
| 0 | 0 |
|
|
|
|
|
|
| IPAIR | NAME | SHIFT | NEWSHIFT | S/N | NAME | SHIFT | NEWSHIFT | S/N |
| 0 | 09080043 | 0.480443 | 0.00000 | 18.9860 | 09080041 | 0.00346438 | 0.476979 | 18.9859 |
| 1 | 09080039 | 0.477593 | 0.00285000 | 19.0486 | 09080044 | 0.00661790 | 0.473825 | 19.0309 |
| 2 | 09080038 | 0.476369 | 0.00407401 | 19.0250 | 09080040 | 0.00381380 | 0.476629 | 19.0303 |
| 3 | 09080042 | 0.478459 | 0.00198400 | 19.0156 | 09080037 | 0.00000 | 0.480443 | 19.0294 |