| Red | Green | Blue | |
| z | 17.64 | ||
| znorm | Inf | ||
| sky | -Inf | -Inf | -Inf |
| S/N | 34.0 | 50.6 | 53.5 |
| S/N(c) | 0.0 | 0.0 | 0.0 |
| SN(E/C) |
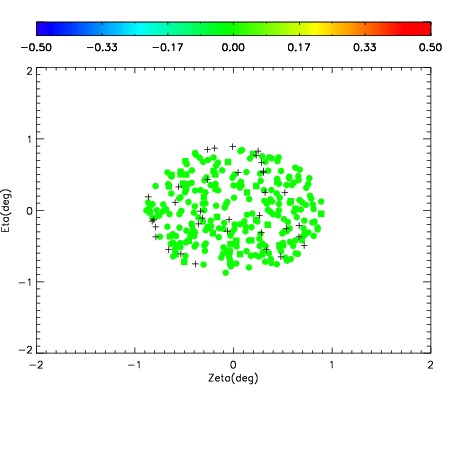

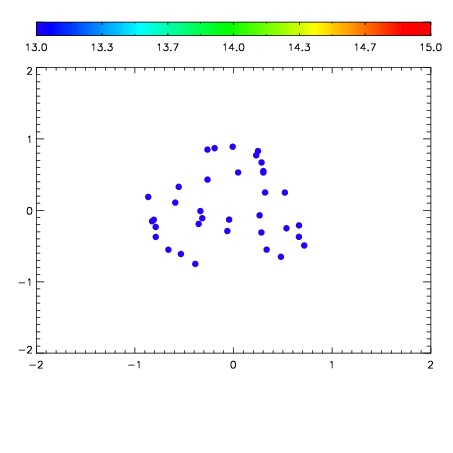

| Frame | Nreads | Zeropoints | Mag plots | Spatial mag deviation | Spatial sky 16325A emission deviations (filled: sky, open: star) | Spatial sky continuum emission | Spatial sky telluric CO2 absorption deviations (filled: H < 10) | |||||||||||||||||||||||
| 0 | 0 |
|
|
|
|
|
|
| IPAIR | NAME | SHIFT | NEWSHIFT | S/N | NAME | SHIFT | NEWSHIFT | S/N |
| 0 | 08420072 | 0.481091 | 0.00000 | 18.9909 | 08420073 | 0.00631916 | 0.474772 | 18.9921 |
| 1 | 08420076 | 0.479039 | 0.00205198 | 19.0846 | 08420077 | 0.00277515 | 0.478316 | 19.0827 |
| 2 | 08420075 | 0.478355 | 0.00273600 | 19.0820 | 08420074 | 0.000352621 | 0.480738 | 19.0086 |
| 3 | 08420071 | 0.480193 | 0.000898004 | 18.9619 | 08420070 | 0.00000 | 0.481091 | 18.8907 |