| Red | Green | Blue | |
| z | 17.64 | ||
| znorm | Inf | ||
| sky | -Inf | -Inf | -Inf |
| S/N | 35.4 | 52.7 | 55.6 |
| S/N(c) | 0.0 | 0.0 | 0.0 |
| SN(E/C) |
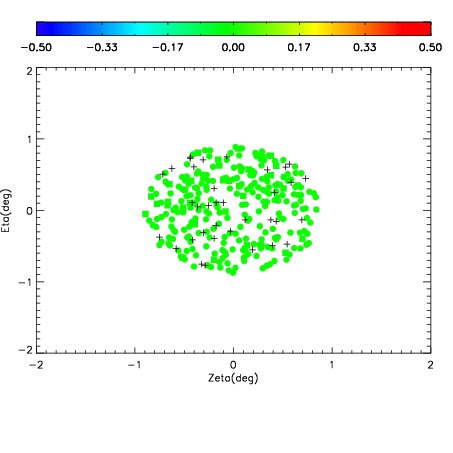
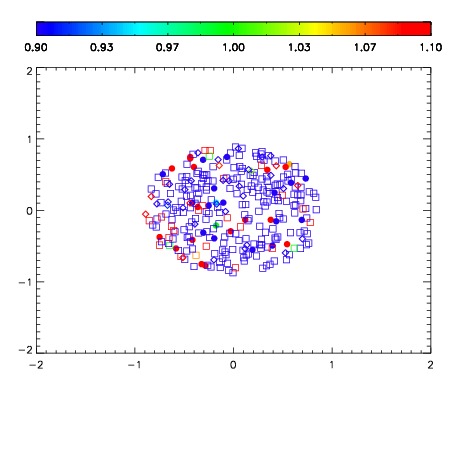


| Frame | Nreads | Zeropoints | Mag plots | Spatial mag deviation | Spatial sky 16325A emission deviations (filled: sky, open: star) | Spatial sky continuum emission | Spatial sky telluric CO2 absorption deviations (filled: H < 10) | |||||||||||||||||||||||
| 0 | 0 |
|
|
|
|
|
|
| IPAIR | NAME | SHIFT | NEWSHIFT | S/N | NAME | SHIFT | NEWSHIFT | S/N |
| 0 | 08180051 | 0.506867 | 0.00000 | 19.2019 | 08180052 | -0.00149874 | 0.508366 | 19.2105 |
| 1 | 08180050 | 0.498307 | 0.00856000 | 19.1961 | 08180049 | -0.00235214 | 0.509219 | 19.1927 |
| 2 | 08180047 | 0.505710 | 0.00115699 | 19.1709 | 08180048 | -0.000745405 | 0.507612 | 19.1829 |
| 3 | 08180046 | 0.501109 | 0.00575799 | 19.1387 | 08180045 | 0.00000 | 0.506867 | 19.0380 |