| Red | Green | Blue | |
| z | 17.64 | ||
| znorm | Inf | ||
| sky | -Inf | -Inf | -Inf |
| S/N | 19.6 | 30.8 | 32.6 |
| S/N(c) | 0.0 | 0.0 | 0.0 |
| SN(E/C) |
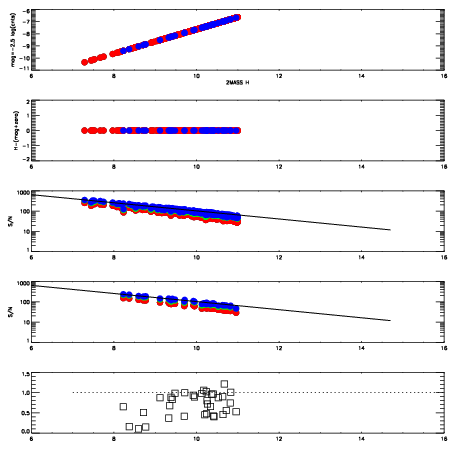
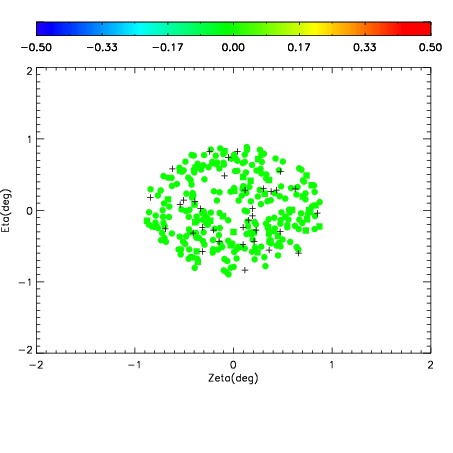
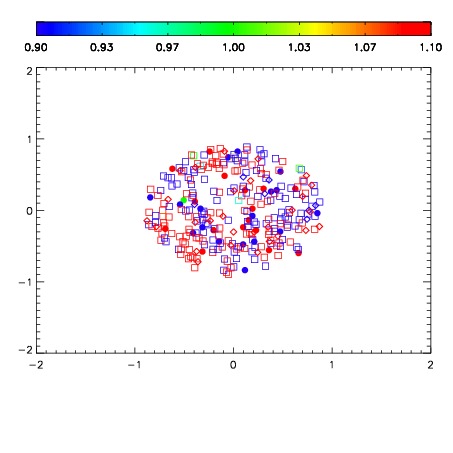


| Frame | Nreads | Zeropoints | Mag plots | Spatial mag deviation | Spatial sky 16325A emission deviations (filled: sky, open: star) | Spatial sky continuum emission | Spatial sky telluric CO2 absorption deviations (filled: H < 10) | |||||||||||||||||||||||
| 0 | 0 |
|
|
|
|
|
|
| IPAIR | NAME | SHIFT | NEWSHIFT | S/N | NAME | SHIFT | NEWSHIFT | S/N |
| 0 | 08690028 | 0.482488 | 0.00000 | 18.2115 | 08690026 | 0.00000 | 0.482488 | 18.3969 |
| 1 | 08690031 | 0.481092 | 0.00139600 | 18.5052 | 08690030 | 0.00326229 | 0.479226 | 18.5149 |
| 2 | 08690027 | 0.481740 | 0.000748008 | 18.3775 | 08690029 | 0.00221534 | 0.480273 | 18.4261 |