| Red | Green | Blue | |
| z | 17.64 | ||
| znorm | Inf | ||
| sky | -Inf | -Inf | -Inf |
| S/N | 15.0 | 25.1 | 25.8 |
| S/N(c) | 0.0 | 0.0 | 0.0 |
| SN(E/C) |
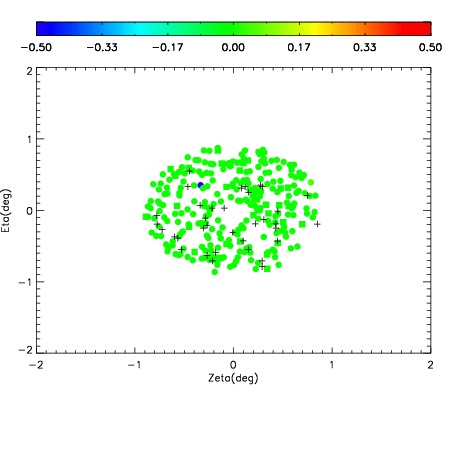
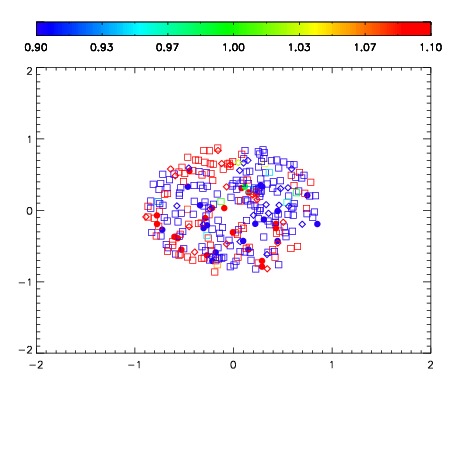
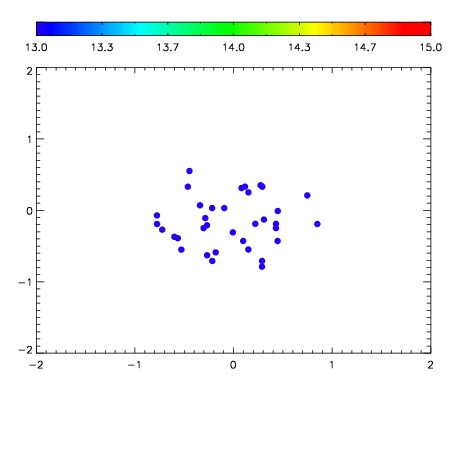

| Frame | Nreads | Zeropoints | Mag plots | Spatial mag deviation | Spatial sky 16325A emission deviations (filled: sky, open: star) | Spatial sky continuum emission | Spatial sky telluric CO2 absorption deviations (filled: H < 10) | |||||||||||||||||||||||
| 0 | 0 |
|
|
|
|
|
|
| IPAIR | NAME | SHIFT | NEWSHIFT | S/N | NAME | SHIFT | NEWSHIFT | S/N |
| 0 | 08430087 | 0.485557 | 0.00000 | 17.3120 | 08430085 | -0.000309486 | 0.485866 | 18.1726 |
| 1 | 08430082 | 0.484244 | 0.00131300 | 18.8000 | 08430081 | 0.00000 | 0.485557 | 18.8139 |
| 2 | 08430083 | 0.484784 | 0.000772983 | 17.2889 | 08430088 | 0.000961438 | 0.484596 | 17.7392 |
| 3 | 08430086 | 0.485208 | 0.000348985 | 17.0652 | 08430084 | -0.000580867 | 0.486138 | 17.7314 |