| Red | Green | Blue | |
| z | 17.64 | ||
| znorm | Inf | ||
| sky | -Inf | -Inf | -Inf |
| S/N | 21.4 | 33.8 | 35.3 |
| S/N(c) | 0.0 | 0.0 | 0.0 |
| SN(E/C) |
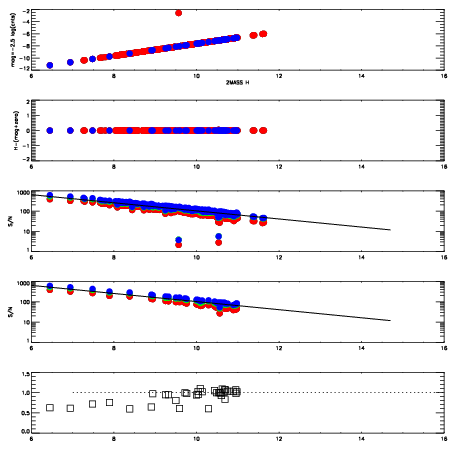
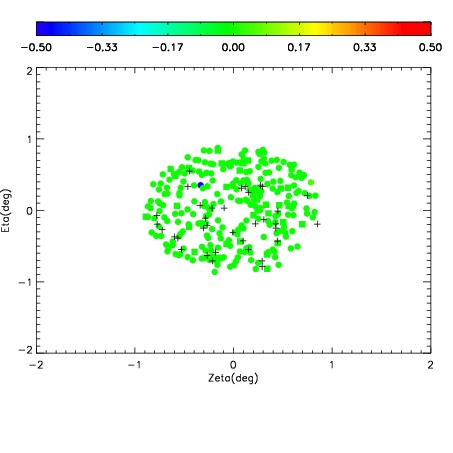
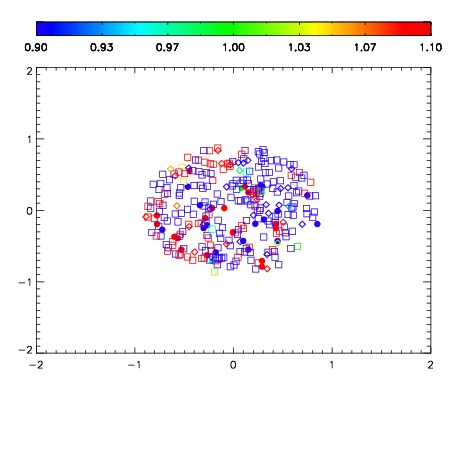
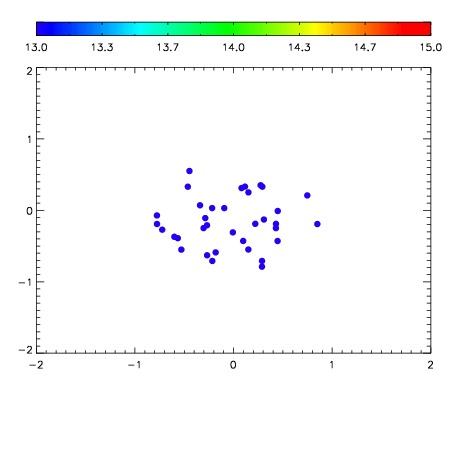

| Frame | Nreads | Zeropoints | Mag plots | Spatial mag deviation | Spatial sky 16325A emission deviations (filled: sky, open: star) | Spatial sky continuum emission | Spatial sky telluric CO2 absorption deviations (filled: H < 10) | |||||||||||||||||||||||
| 0 | 0 |
|
|
|
|
|
|
| IPAIR | NAME | SHIFT | NEWSHIFT | S/N | NAME | SHIFT | NEWSHIFT | S/N |
| 0 | 08440071 | 0.487234 | 0.00000 | 18.8584 | 08440073 | 0.00142703 | 0.485807 | 18.8541 |
| 1 | 08440074 | 0.483504 | 0.00373000 | 18.8781 | 08440069 | 0.00000 | 0.487234 | 18.8977 |
| 2 | 08440070 | 0.487091 | 0.000142992 | 18.8631 | 08440072 | 0.00414063 | 0.483093 | 18.8634 |