| Red | Green | Blue | |
| z | 17.64 | ||
| znorm | Inf | ||
| sky | -Inf | -Inf | -Inf |
| S/N | 29.7 | 43.9 | 45.7 |
| S/N(c) | 0.0 | 0.0 | 0.0 |
| SN(E/C) |
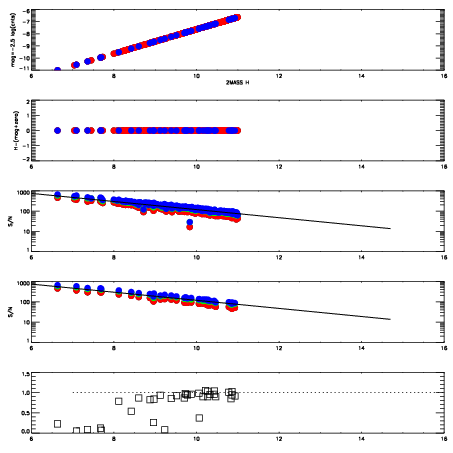
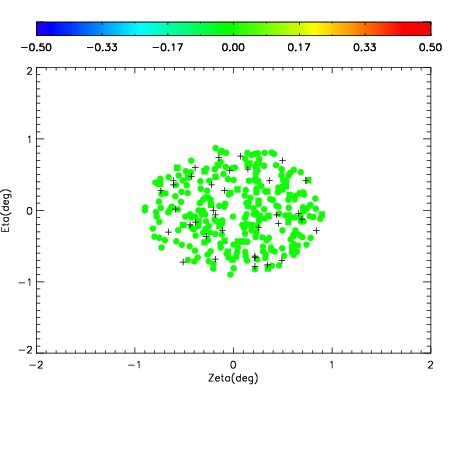
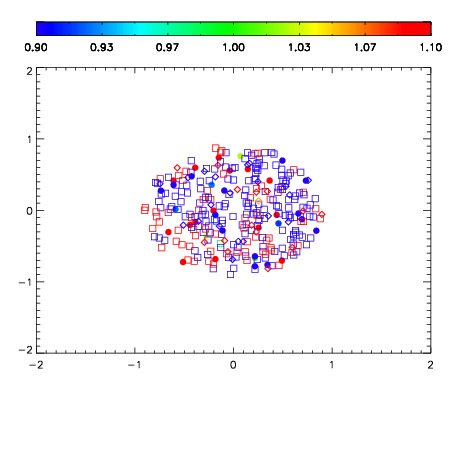


| Frame | Nreads | Zeropoints | Mag plots | Spatial mag deviation | Spatial sky 16325A emission deviations (filled: sky, open: star) | Spatial sky continuum emission | Spatial sky telluric CO2 absorption deviations (filled: H < 10) | |||||||||||||||||||||||
| 0 | 0 |
|
|
|
|
|
|
| IPAIR | NAME | SHIFT | NEWSHIFT | S/N | NAME | SHIFT | NEWSHIFT | S/N |
| 0 | 08500061 | 0.487540 | 0.00000 | 18.8862 | 08500062 | 0.00210839 | 0.485432 | 18.8448 |
| 1 | 08500060 | 0.486317 | 0.00122300 | 18.9121 | 08500058 | 0.00404774 | 0.483492 | 18.9066 |
| 2 | 08500056 | 0.484903 | 0.00263700 | 18.8347 | 08500059 | 0.00314028 | 0.484400 | 18.8415 |
| 3 | 08500057 | 0.487534 | 6.02007e-06 | 18.7997 | 08500055 | 0.00000 | 0.487540 | 18.7766 |