| Red | Green | Blue | |
| z | 17.64 | ||
| znorm | Inf | ||
| sky | -NaN | -Inf | -Inf |
| S/N | 14.4 | 23.4 | 24.5 |
| S/N(c) | 0.0 | 0.0 | 0.0 |
| SN(E/C) |
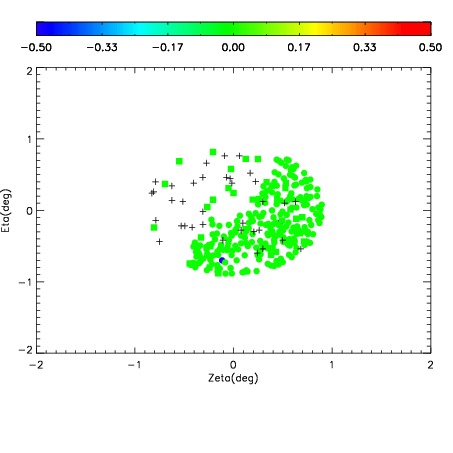
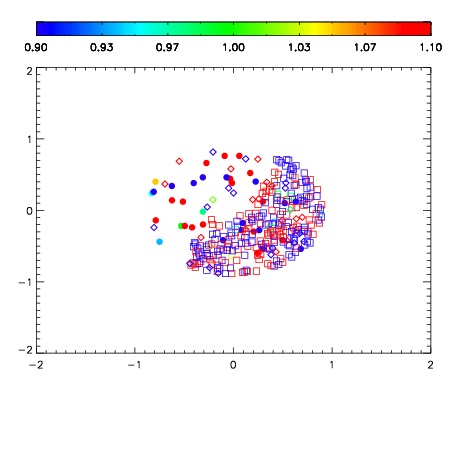


| Frame | Nreads | Zeropoints | Mag plots | Spatial mag deviation | Spatial sky 16325A emission deviations (filled: sky, open: star) | Spatial sky continuum emission | Spatial sky telluric CO2 absorption deviations (filled: H < 10) | |||||||||||||||||||||||
| 0 | 0 |
|
|
|
|
|
|
| IPAIR | NAME | SHIFT | NEWSHIFT | S/N | NAME | SHIFT | NEWSHIFT | S/N |
| 0 | 12490026 | 0.497455 | 0.00000 | 17.7803 | 12490024 | 0.000345360 | 0.497110 | 17.8089 |
| 1 | 12490022 | 0.493322 | 0.00413299 | 17.8368 | 12490027 | 0.00264931 | 0.494806 | 18.2446 |
| 2 | 12490025 | 0.494498 | 0.00295699 | 17.5730 | 12490023 | -0.00196933 | 0.499424 | 17.7607 |
| 3 | 12490021 | 0.493822 | 0.00363299 | 17.3532 | 12490020 | 0.00000 | 0.497455 | 16.9646 |