| Red | Green | Blue | |
| z | 17.64 | ||
| znorm | Inf | ||
| sky | -Inf | -NaN | -Inf |
| S/N | 29.4 | 42.1 | 44.9 |
| S/N(c) | 0.0 | 0.0 | 0.0 |
| SN(E/C) |
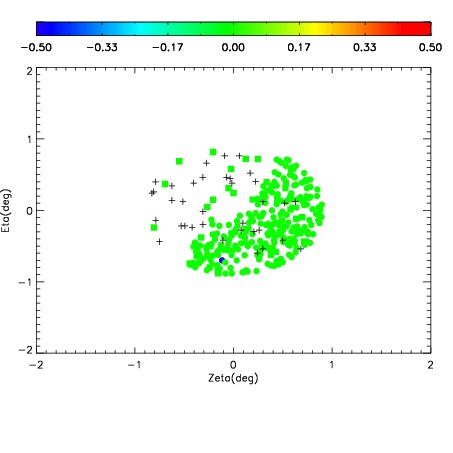
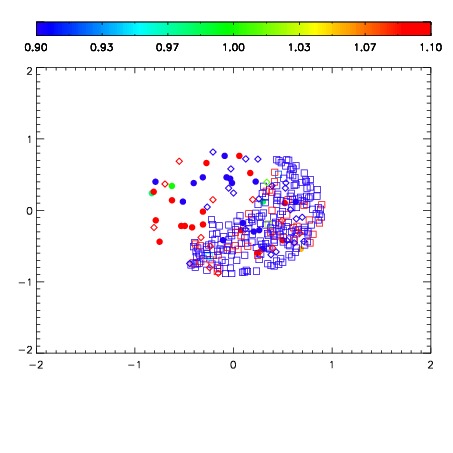


| Frame | Nreads | Zeropoints | Mag plots | Spatial mag deviation | Spatial sky 16325A emission deviations (filled: sky, open: star) | Spatial sky continuum emission | Spatial sky telluric CO2 absorption deviations (filled: H < 10) | |||||||||||||||||||||||
| 0 | 0 |
|
|
|
|
|
|
| IPAIR | NAME | SHIFT | NEWSHIFT | S/N | NAME | SHIFT | NEWSHIFT | S/N |
| 0 | 12530050 | 0.487819 | 0.00000 | 18.8670 | 12530055 | 0.00276236 | 0.485057 | 18.8887 |
| 1 | 12530049 | 0.486504 | 0.00131500 | 18.9315 | 12530048 | 0.00000 | 0.487819 | 18.9191 |
| 2 | 12530053 | 0.486606 | 0.00121298 | 18.8394 | 12530052 | 0.00260579 | 0.485213 | 18.8373 |
| 3 | 12530054 | 0.486647 | 0.00117198 | 18.8065 | 12530051 | 0.00259270 | 0.485226 | 18.5317 |