| Red | Green | Blue | |
| z | 17.64 | ||
| znorm | Inf | ||
| sky | -Inf | -Inf | -Inf |
| S/N | 22.8 | 33.6 | 36.1 |
| S/N(c) | 0.0 | 0.0 | 0.0 |
| SN(E/C) |
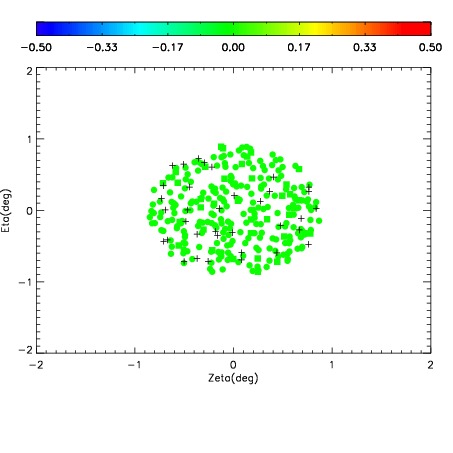
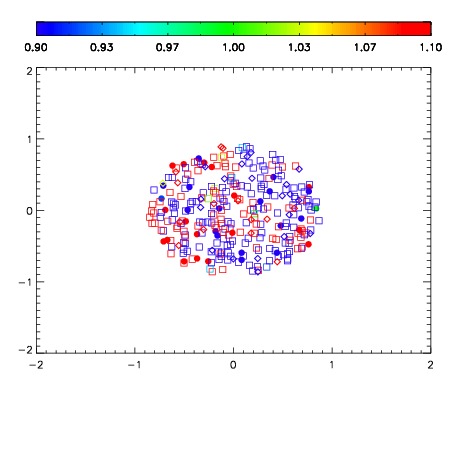


| Frame | Nreads | Zeropoints | Mag plots | Spatial mag deviation | Spatial sky 16325A emission deviations (filled: sky, open: star) | Spatial sky continuum emission | Spatial sky telluric CO2 absorption deviations (filled: H < 10) | |||||||||||||||||||||||
| 0 | 0 |
|
|
|
|
|
|
| IPAIR | NAME | SHIFT | NEWSHIFT | S/N | NAME | SHIFT | NEWSHIFT | S/N |
| 0 | 08190071 | 0.511453 | 0.00000 | 18.5080 | 08190072 | -0.00177076 | 0.513224 | 18.7349 |
| 1 | 08190074 | 0.502588 | 0.00886500 | 18.8173 | 08190073 | -0.00189003 | 0.513343 | 18.7709 |
| 2 | 08190070 | 0.508138 | 0.00331497 | 18.4903 | 08190069 | 0.00000 | 0.511453 | 18.5703 |