| Red | Green | Blue | |
| z | 17.64 | ||
| znorm | Inf | ||
| sky | -Inf | -Inf | -NaN |
| S/N | 27.1 | 46.0 | 46.9 |
| S/N(c) | 0.0 | 0.0 | 0.0 |
| SN(E/C) |
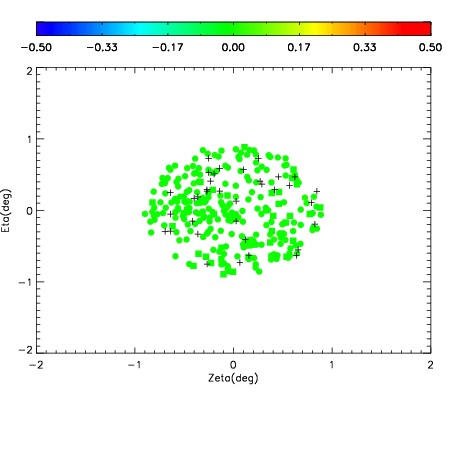
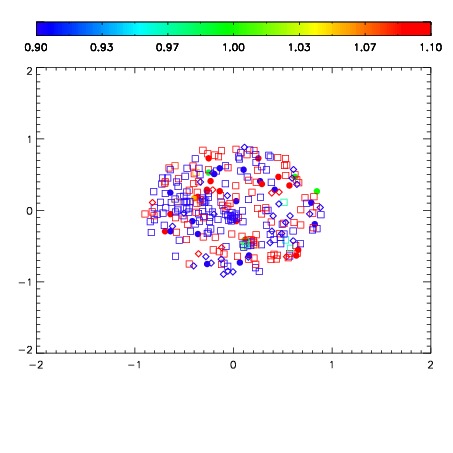
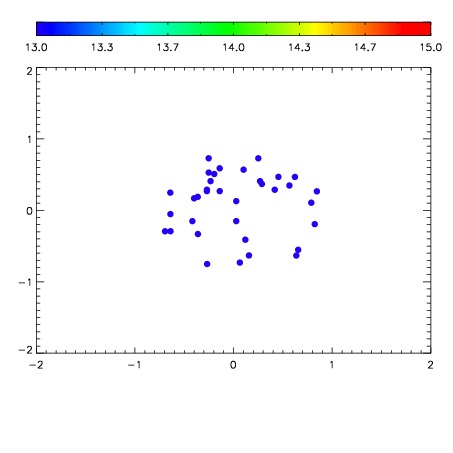

| Frame | Nreads | Zeropoints | Mag plots | Spatial mag deviation | Spatial sky 16325A emission deviations (filled: sky, open: star) | Spatial sky continuum emission | Spatial sky telluric CO2 absorption deviations (filled: H < 10) | |||||||||||||||||||||||
| 0 | 0 |
|
|
|
|
|
|
| IPAIR | NAME | SHIFT | NEWSHIFT | S/N | NAME | SHIFT | NEWSHIFT | S/N |
| 0 | 09070041 | 0.480542 | 0.00000 | 18.9494 | 09070036 | 0.00000 | 0.480542 | 18.9536 |
| 1 | 09070042 | 0.479820 | 0.000721991 | 19.0366 | 09070043 | 0.00898024 | 0.471562 | 19.0332 |
| 2 | 09070037 | 0.477401 | 0.00314102 | 18.9892 | 09070040 | 0.00185300 | 0.478689 | 19.0038 |
| 3 | 09070038 | 0.478382 | 0.00216001 | 18.9580 | 09070039 | 0.00174199 | 0.478800 | 18.9818 |