| Red | Green | Blue | |
| z | 17.64 | ||
| znorm | Inf | ||
| sky | -NaN | -NaN | -Inf |
| S/N | 29.0 | 49.3 | 50.3 |
| S/N(c) | 0.0 | 0.0 | 0.0 |
| SN(E/C) |
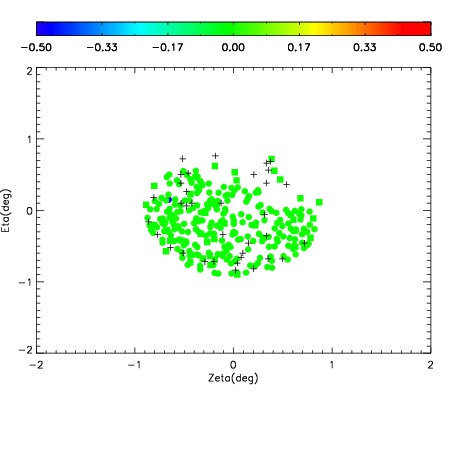
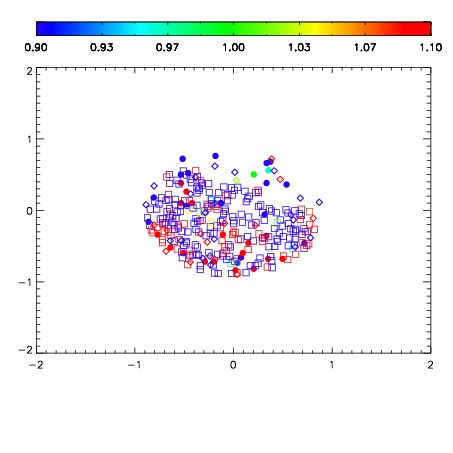
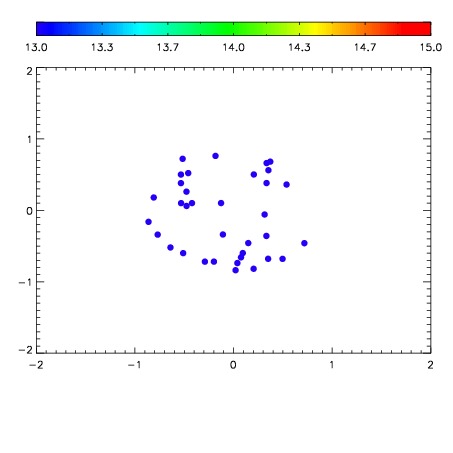

| Frame | Nreads | Zeropoints | Mag plots | Spatial mag deviation | Spatial sky 16325A emission deviations (filled: sky, open: star) | Spatial sky continuum emission | Spatial sky telluric CO2 absorption deviations (filled: H < 10) | |||||||||||||||||||||||
| 0 | 0 |
|
|
|
|
|
|
| IPAIR | NAME | SHIFT | NEWSHIFT | S/N | NAME | SHIFT | NEWSHIFT | S/N |
| 0 | 12480028 | 0.496575 | 0.00000 | 19.1039 | 12480025 | -0.00158812 | 0.498163 | 19.0760 |
| 1 | 12480023 | 0.493816 | 0.00275901 | 19.0518 | 12480022 | 0.00000 | 0.496575 | 19.0679 |
| 2 | 12480024 | 0.493686 | 0.00288901 | 19.0412 | 12480026 | -0.00114851 | 0.497724 | 19.0526 |
| 3 | 12480027 | 0.496326 | 0.000248998 | 18.9624 | 12480029 | -0.000479833 | 0.497055 | 18.9990 |