| Red | Green | Blue | |
| z | 17.64 | ||
| znorm | Inf | ||
| sky | -Inf | -Inf | -Inf |
| S/N | 23.4 | 35.4 | 37.1 |
| S/N(c) | 0.0 | 0.0 | 0.0 |
| SN(E/C) |
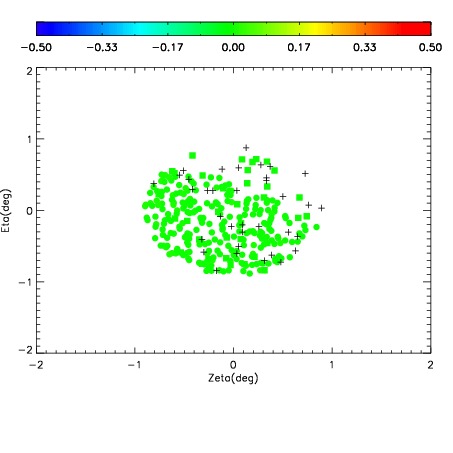
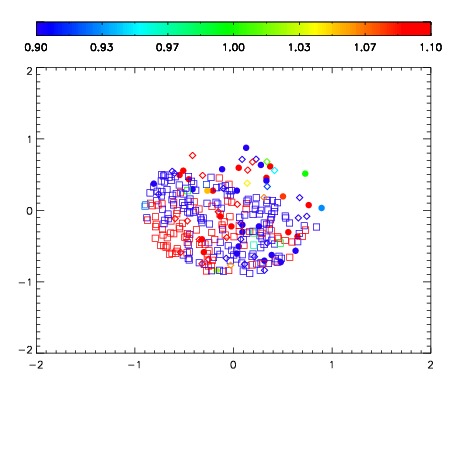


| Frame | Nreads | Zeropoints | Mag plots | Spatial mag deviation | Spatial sky 16325A emission deviations (filled: sky, open: star) | Spatial sky continuum emission | Spatial sky telluric CO2 absorption deviations (filled: H < 10) | |||||||||||||||||||||||
| 0 | 0 |
|
|
|
|
|
|
| IPAIR | NAME | SHIFT | NEWSHIFT | S/N | NAME | SHIFT | NEWSHIFT | S/N |
| 0 | 12490032 | 0.492994 | 0.00000 | 17.8492 | 12490031 | 0.00000 | 0.492994 | 18.2164 |
| 1 | 12490036 | 0.492286 | 0.000708014 | 18.7274 | 12490038 | -0.00213438 | 0.495128 | 18.5575 |
| 2 | 12490037 | 0.492580 | 0.000414014 | 18.7192 | 12490035 | 0.000779793 | 0.492214 | 18.4427 |
| 3 | 12490033 | 0.492800 | 0.000194013 | 18.4861 | 12490034 | 0.000732355 | 0.492262 | 18.2869 |