| Red | Green | Blue | |
| z | 17.64 | ||
| znorm | Inf | ||
| sky | -Inf | -Inf | -Inf |
| S/N | 32.6 | 48.3 | 50.8 |
| S/N(c) | 0.0 | 0.0 | 0.0 |
| SN(E/C) |
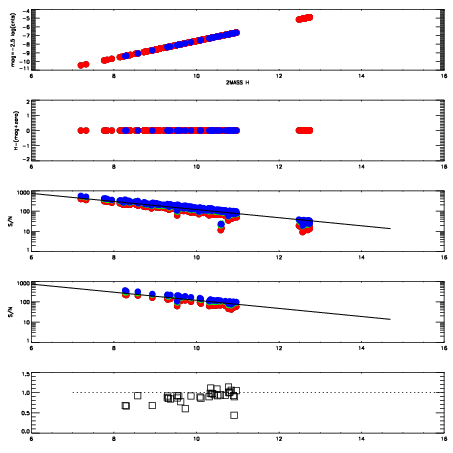
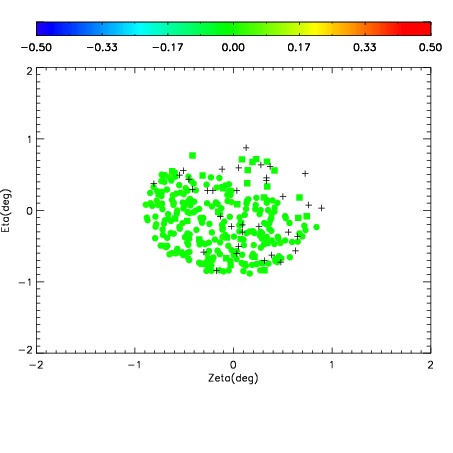


| Frame | Nreads | Zeropoints | Mag plots | Spatial mag deviation | Spatial sky 16325A emission deviations (filled: sky, open: star) | Spatial sky continuum emission | Spatial sky telluric CO2 absorption deviations (filled: H < 10) | |||||||||||||||||||||||
| 0 | 0 |
|
|
|
|
|
|
| IPAIR | NAME | SHIFT | NEWSHIFT | S/N | NAME | SHIFT | NEWSHIFT | S/N |
| 0 | 12530064 | 0.481748 | 0.00000 | 18.8413 | 12530066 | -0.00290360 | 0.484652 | 18.8519 |
| 1 | 12530060 | 0.479546 | 0.00220200 | 19.0310 | 12530063 | -0.00219926 | 0.483947 | 19.0052 |
| 2 | 12530061 | 0.480759 | 0.000989020 | 19.0095 | 12530059 | 0.00000 | 0.481748 | 18.9927 |
| 3 | 12530065 | 0.481717 | 3.10242e-05 | 18.8999 | 12530062 | -0.00105256 | 0.482801 | 18.9456 |