| Red | Green | Blue | |
| z | 17.64 | ||
| znorm | Inf | ||
| sky | -Inf | -Inf | -Inf |
| S/N | 29.9 | 48.5 | 50.5 |
| S/N(c) | 0.0 | 0.0 | 0.0 |
| SN(E/C) |


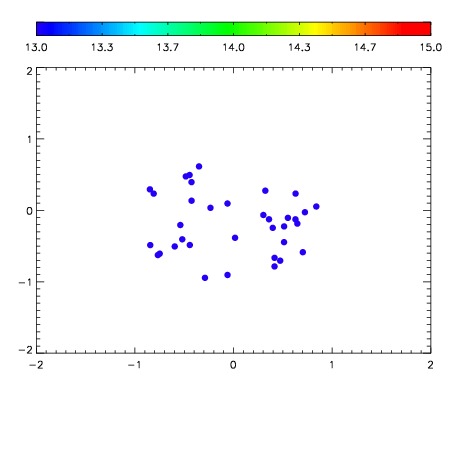

| Frame | Nreads | Zeropoints | Mag plots | Spatial mag deviation | Spatial sky 16325A emission deviations (filled: sky, open: star) | Spatial sky continuum emission | Spatial sky telluric CO2 absorption deviations (filled: H < 10) | |||||||||||||||||||||||
| 0 | 0 |
|
|
|
|
|
|
| IPAIR | NAME | SHIFT | NEWSHIFT | S/N | NAME | SHIFT | NEWSHIFT | S/N |
| 0 | 09730012 | 0.510255 | 0.00000 | 19.1145 | 09730015 | 0.000687514 | 0.509567 | 19.1825 |
| 1 | 09730017 | 0.509749 | 0.000505984 | 19.2244 | 09730014 | 0.000623567 | 0.509631 | 19.2299 |
| 2 | 09730016 | 0.509454 | 0.000800967 | 19.1610 | 09730018 | 0.00291741 | 0.507338 | 19.2261 |
| 3 | 09730013 | 0.510098 | 0.000156999 | 19.1336 | 09730011 | 0.00000 | 0.510255 | 19.1973 |