| Red | Green | Blue | |
| z | 17.64 | ||
| znorm | Inf | ||
| sky | -Inf | -Inf | -Inf |
| S/N | 12.8 | 18.9 | 16.3 |
| S/N(c) | 0.0 | 0.0 | 0.0 |
| SN(E/C) |
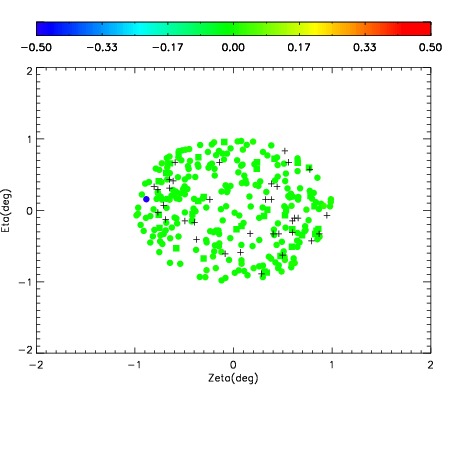
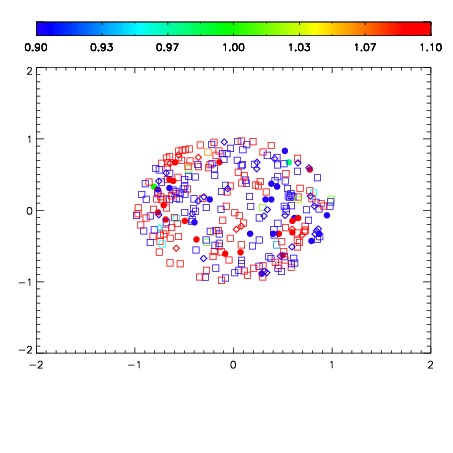
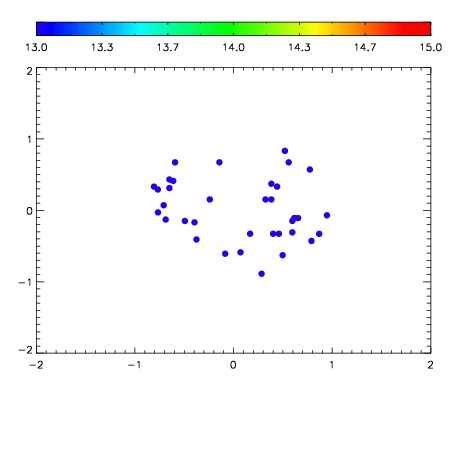

| Frame | Nreads | Zeropoints | Mag plots | Spatial mag deviation | Spatial sky 16325A emission deviations (filled: sky, open: star) | Spatial sky continuum emission | Spatial sky telluric CO2 absorption deviations (filled: H < 10) | |||||||||||||||||||||||
| 0 | 0 |
|
|
|
|
|
|
| IPAIR | NAME | SHIFT | NEWSHIFT | S/N | NAME | SHIFT | NEWSHIFT | S/N |
| 0 | 08730061 | 0.483246 | 0.00000 | 17.9477 | 08730062 | 0.00360547 | 0.479641 | 17.4897 |
| 1 | 08730060 | 0.482056 | 0.00119001 | 18.4274 | 08730059 | 0.00000 | 0.483246 | 18.6943 |
| 2 | 08730065 | 0.482712 | 0.000533998 | 15.3262 | 08730063 | 0.00358852 | 0.479657 | 16.3494 |
| 3 | 08730064 | 0.482515 | 0.000730991 | 15.2274 | 08730066 | -0.000473748 | 0.483720 | 16.2916 |