| Red | Green | Blue | |
| z | 17.64 | ||
| znorm | Inf | ||
| sky | -NaN | -Inf | -NaN |
| S/N | 22.2 | 31.2 | 26.9 |
| S/N(c) | 0.0 | 0.0 | 0.0 |
| SN(E/C) |
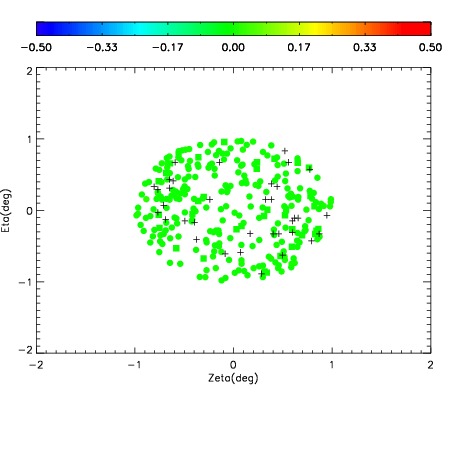
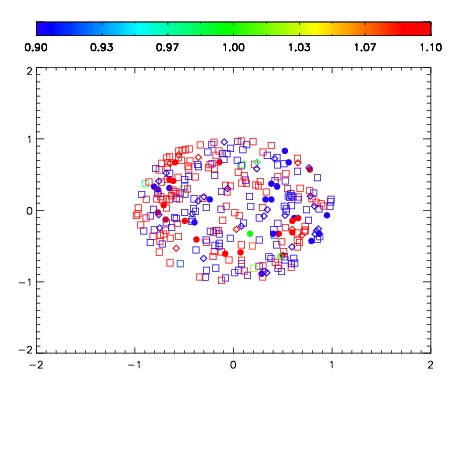
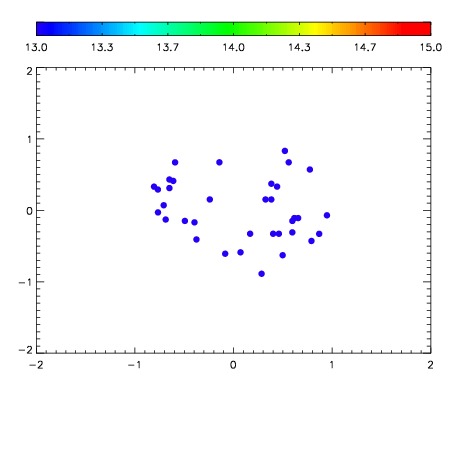

| Frame | Nreads | Zeropoints | Mag plots | Spatial mag deviation | Spatial sky 16325A emission deviations (filled: sky, open: star) | Spatial sky continuum emission | Spatial sky telluric CO2 absorption deviations (filled: H < 10) | |||||||||||||||||||||||
| 0 | 0 |
|
|
|
|
|
|
| IPAIR | NAME | SHIFT | NEWSHIFT | S/N | NAME | SHIFT | NEWSHIFT | S/N |
| 0 | 08750027 | 0.484619 | 0.00000 | 18.9265 | 08750026 | 0.00142051 | 0.483198 | 18.7701 |
| 1 | 08750028 | 0.484393 | 0.000225991 | 18.9628 | 08750029 | 0.000820372 | 0.483799 | 18.9236 |
| 2 | 08750024 | 0.483819 | 0.000799984 | 17.8531 | 08750025 | 0.00153139 | 0.483088 | 18.1458 |
| 3 | 08750023 | 0.484166 | 0.000452995 | 17.7906 | 08750022 | 0.00000 | 0.484619 | 17.8632 |