| Red | Green | Blue | |
| z | 17.64 | ||
| znorm | Inf | ||
| sky | -NaN | -Inf | -Inf |
| S/N | 41.0 | 59.8 | 63.5 |
| S/N(c) | 0.0 | 0.0 | 0.0 |
| SN(E/C) |

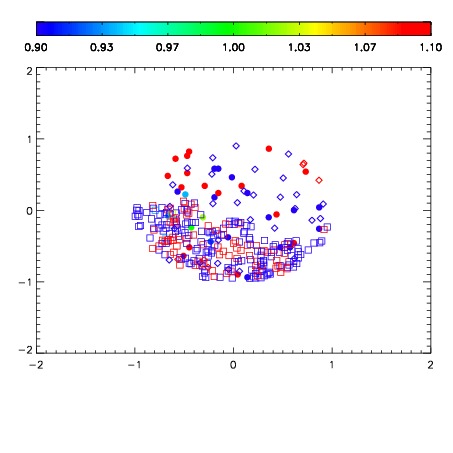
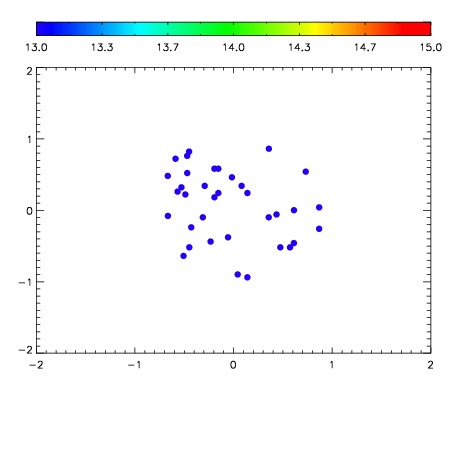

| Frame | Nreads | Zeropoints | Mag plots | Spatial mag deviation | Spatial sky 16325A emission deviations (filled: sky, open: star) | Spatial sky continuum emission | Spatial sky telluric CO2 absorption deviations (filled: H < 10) | |||||||||||||||||||||||
| 0 | 0 |
|
|
|
|
|
|
| IPAIR | NAME | SHIFT | NEWSHIFT | S/N | NAME | SHIFT | NEWSHIFT | S/N |
| 0 | 08420083 | 0.481961 | 0.00000 | 19.1520 | 08420084 | 0.00474972 | 0.477211 | 19.1443 |
| 1 | 08420082 | 0.480734 | 0.00122702 | 19.1402 | 08420081 | 0.00000 | 0.481961 | 19.1319 |
| 2 | 08420087 | 0.479954 | 0.00200701 | 19.1311 | 08420085 | -0.00381970 | 0.485781 | 19.1294 |
| 3 | 08420086 | 0.478699 | 0.00326201 | 19.1137 | 08420089 | -0.000868363 | 0.482829 | 19.1034 |
| 4 | 08420090 | 0.481542 | 0.000419021 | 19.1015 | 08420088 | 0.000713856 | 0.481247 | 19.0600 |