| Red | Green | Blue | |
| z | 17.64 | ||
| znorm | Inf | ||
| sky | -Inf | -Inf | -Inf |
| S/N | 16.1 | 26.3 | 28.8 |
| S/N(c) | 0.0 | 0.0 | 0.0 |
| SN(E/C) |
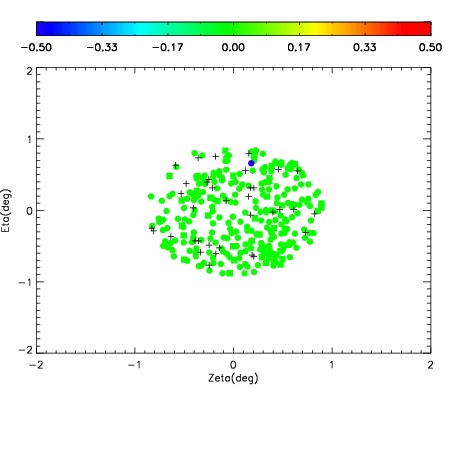
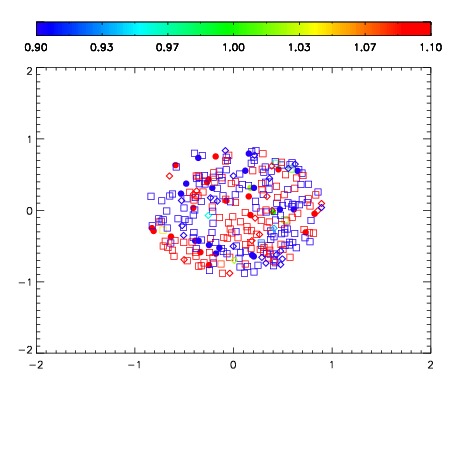


| Frame | Nreads | Zeropoints | Mag plots | Spatial mag deviation | Spatial sky 16325A emission deviations (filled: sky, open: star) | Spatial sky continuum emission | Spatial sky telluric CO2 absorption deviations (filled: H < 10) | |||||||||||||||||||||||
| 0 | 0 |
|
|
|
|
|
|
| IPAIR | NAME | SHIFT | NEWSHIFT | S/N | NAME | SHIFT | NEWSHIFT | S/N |
| 0 | 08430071 | 0.492614 | 0.00000 | 17.4422 | 08430073 | 0.00135610 | 0.491258 | 17.2610 |
| 1 | 08430075 | 0.489289 | 0.00332502 | 18.4433 | 08430077 | 0.00319494 | 0.489419 | 18.8543 |
| 2 | 08430076 | 0.489934 | 0.00268000 | 18.3843 | 08430074 | 0.00246474 | 0.490149 | 18.1663 |
| 3 | 08430072 | 0.492581 | 3.29912e-05 | 17.4768 | 08430070 | 0.00000 | 0.492614 | 18.0175 |