| Red | Green | Blue | |
| z | 17.64 | ||
| znorm | Inf | ||
| sky | -Inf | -Inf | -Inf |
| S/N | 22.4 | 33.4 | 35.6 |
| S/N(c) | 0.0 | 0.0 | 0.0 |
| SN(E/C) |
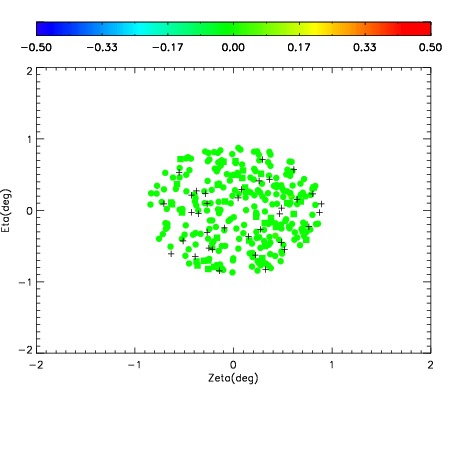
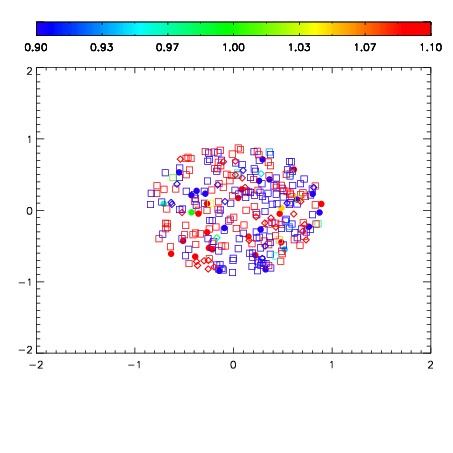
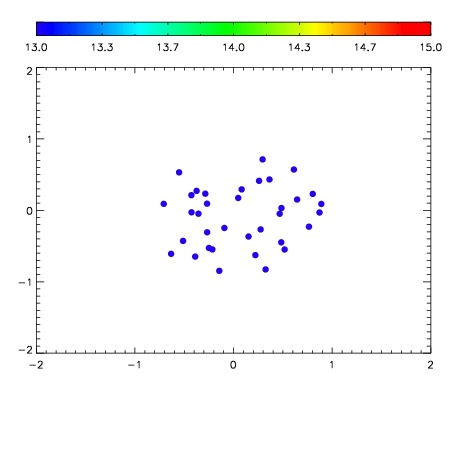

| Frame | Nreads | Zeropoints | Mag plots | Spatial mag deviation | Spatial sky 16325A emission deviations (filled: sky, open: star) | Spatial sky continuum emission | Spatial sky telluric CO2 absorption deviations (filled: H < 10) | |||||||||||||||||||||||
| 0 | 0 |
|
|
|
|
|
|
| IPAIR | NAME | SHIFT | NEWSHIFT | S/N | NAME | SHIFT | NEWSHIFT | S/N |
| 0 | 08460111 | 0.491584 | 0.00000 | 18.2539 | 08460105 | 0.00000 | 0.491584 | 18.3166 |
| 1 | 08460106 | 0.488281 | 0.00330299 | 18.5133 | 08460112 | 0.00600972 | 0.485574 | 18.6331 |
| 2 | 08460110 | 0.489818 | 0.00176600 | 18.4964 | 08460108 | 0.00586267 | 0.485721 | 18.3753 |
| 3 | 08460107 | 0.490292 | 0.00129199 | 18.2776 | 08460109 | 0.00556157 | 0.486022 | 18.3560 |