| Red | Green | Blue | |
| z | 17.64 | ||
| znorm | Inf | ||
| sky | -Inf | -Inf | -Inf |
| S/N | 18.5 | 28.0 | 29.5 |
| S/N(c) | 0.0 | 0.0 | 0.0 |
| SN(E/C) |
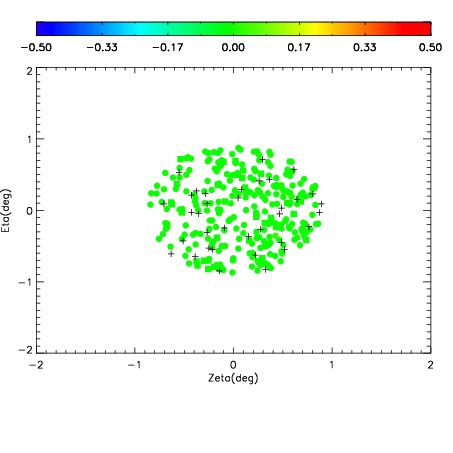
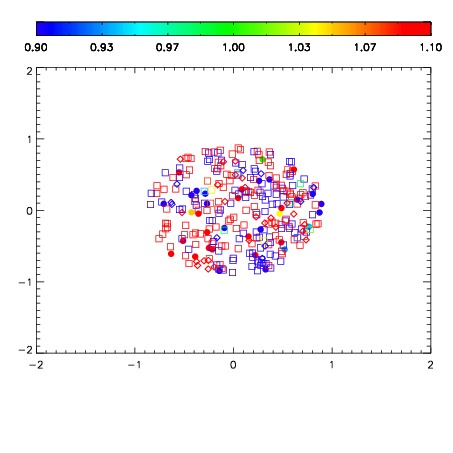
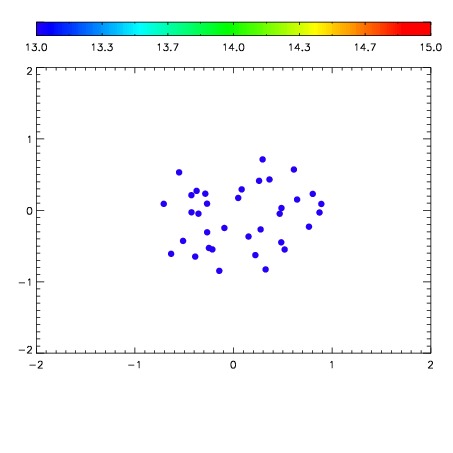

| Frame | Nreads | Zeropoints | Mag plots | Spatial mag deviation | Spatial sky 16325A emission deviations (filled: sky, open: star) | Spatial sky continuum emission | Spatial sky telluric CO2 absorption deviations (filled: H < 10) | |||||||||||||||||||||||
| 0 | 0 |
|
|
|
|
|
|
| IPAIR | NAME | SHIFT | NEWSHIFT | S/N | NAME | SHIFT | NEWSHIFT | S/N |
| 0 | 08470095 | 0.485494 | 0.00000 | 17.7734 | 08470093 | 0.00000 | 0.485494 | 17.9406 |
| 1 | 08470098 | 0.483421 | 0.00207299 | 18.4526 | 08470100 | 0.0514819 | 0.434012 | 18.4905 |
| 2 | 08470099 | 0.485218 | 0.000275999 | 18.2459 | 08470097 | 0.00256150 | 0.482932 | 18.1999 |
| 3 | 08470094 | 0.484889 | 0.000604987 | 17.8358 | 08470096 | 0.00507274 | 0.480421 | 18.0163 |