| Red | Green | Blue | |
| z | 17.64 | ||
| znorm | Inf | ||
| sky | -Inf | -Inf | -Inf |
| S/N | 33.3 | 52.7 | 56.5 |
| S/N(c) | 0.0 | 0.0 | 0.0 |
| SN(E/C) |

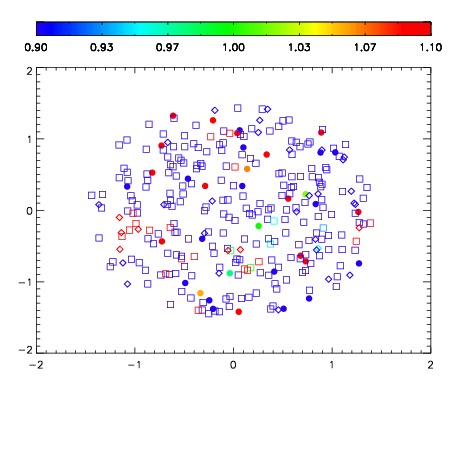


| Frame | Nreads | Zeropoints | Mag plots | Spatial mag deviation | Spatial sky 16325A emission deviations (filled: sky, open: star) | Spatial sky continuum emission | Spatial sky telluric CO2 absorption deviations (filled: H < 10) | |||||||||||||||||||||||
| 0 | 0 |
|
|
|
|
|
|
| IPAIR | NAME | SHIFT | NEWSHIFT | S/N | NAME | SHIFT | NEWSHIFT | S/N |
| 0 | 08150076 | 0.514633 | 0.00000 | 18.5375 | 08150073 | -0.00272398 | 0.517357 | 18.7153 |
| 1 | 08150071 | 0.494188 | 0.0204450 | 18.7912 | 08150074 | -0.00365374 | 0.518287 | 18.8711 |
| 2 | 08150079 | 0.492392 | 0.0222410 | 18.7553 | 08150070 | 0.00000 | 0.514633 | 18.8229 |
| 3 | 08150072 | 0.511601 | 0.00303203 | 18.6591 | 08150078 | -0.00665837 | 0.521291 | 18.7412 |
| 4 | 08150080 | 0.507362 | 0.00727099 | 18.5003 | 08150081 | -0.00557170 | 0.520205 | 18.7057 |
| 5 | 08150075 | 0.495089 | 0.0195440 | 18.4836 | 08150077 | -0.00487450 | 0.519508 | 18.6503 |