| Red | Green | Blue | |
| z | 17.64 | ||
| znorm | Inf | ||
| sky | -NaN | -NaN | -Inf |
| S/N | 33.4 | 50.9 | 56.8 |
| S/N(c) | 0.0 | 0.0 | 0.0 |
| SN(E/C) |
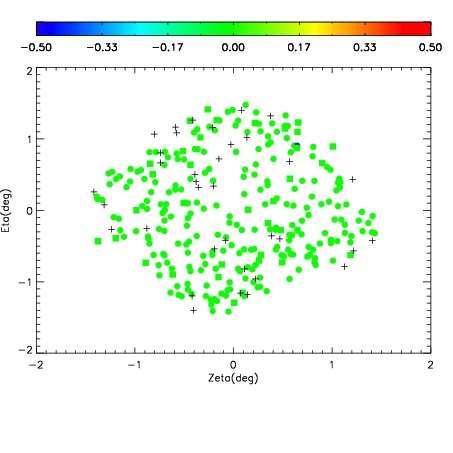
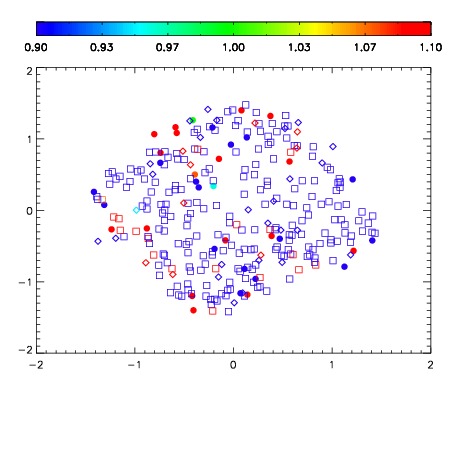


| Frame | Nreads | Zeropoints | Mag plots | Spatial mag deviation | Spatial sky 16325A emission deviations (filled: sky, open: star) | Spatial sky continuum emission | Spatial sky telluric CO2 absorption deviations (filled: H < 10) | |||||||||||||||||||||||
| 0 | 0 |
|
|
|
|
|
|
| IPAIR | NAME | SHIFT | NEWSHIFT | S/N | NAME | SHIFT | NEWSHIFT | S/N |
| 0 | 08850016 | 0.477257 | 0.00000 | 19.0665 | 08850018 | -0.00513505 | 0.482392 | 19.0627 |
| 1 | 08850017 | 0.476548 | 0.000709027 | 19.0550 | 08850011 | 0.00000 | 0.477257 | 19.0229 |
| 2 | 08850012 | 0.474650 | 0.00260702 | 19.0178 | 08850014 | -0.00511199 | 0.482369 | 18.9816 |
| 3 | 08850013 | 0.474284 | 0.00297302 | 19.0018 | 08850015 | -0.00485834 | 0.482115 | 18.9261 |