| Red | Green | Blue | |
| z | 17.64 | ||
| znorm | Inf | ||
| sky | -Inf | -Inf | -NaN |
| S/N | 12.9 | 21.6 | 22.5 |
| S/N(c) | 0.0 | 0.0 | 0.0 |
| SN(E/C) |
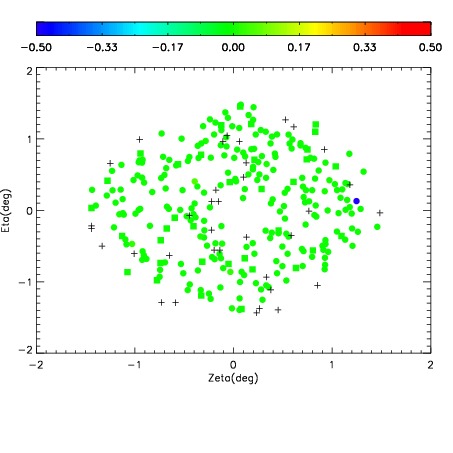
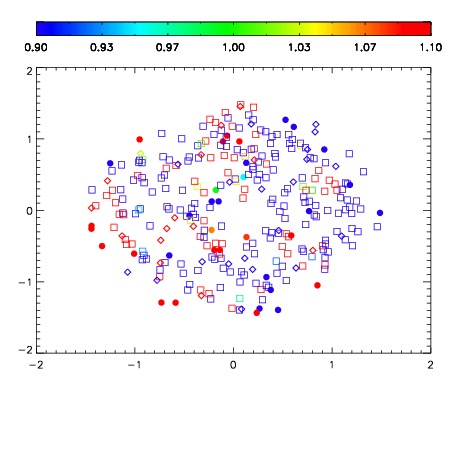
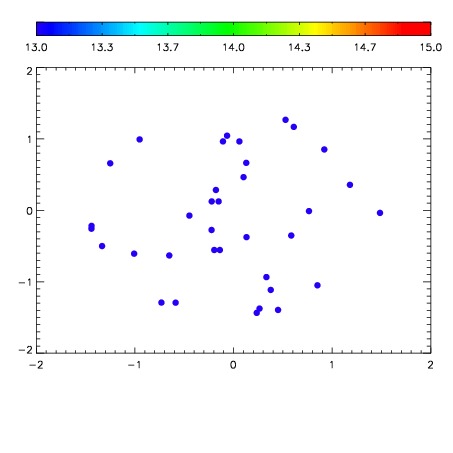

| Frame | Nreads | Zeropoints | Mag plots | Spatial mag deviation | Spatial sky 16325A emission deviations (filled: sky, open: star) | Spatial sky continuum emission | Spatial sky telluric CO2 absorption deviations (filled: H < 10) | |||||||||||||||||||||||
| 0 | 0 |
|
|
|
|
|
|
| IPAIR | NAME | SHIFT | NEWSHIFT | S/N | NAME | SHIFT | NEWSHIFT | S/N |
| 0 | 08790011 | 0.477427 | 0.00000 | 15.9775 | 08790010 | 0.00000 | 0.477427 | 15.0689 |
| 1 | 08790012 | 0.476353 | 0.00107402 | 17.8863 | 08790014 | 0.000152011 | 0.477275 | 18.3319 |
| 2 | 08790015 | 0.475629 | 0.00179800 | 17.3574 | 08790017 | 0.000499309 | 0.476928 | 18.1682 |
| 3 | 08790016 | 0.476082 | 0.00134501 | 16.9541 | 08790013 | 0.000722272 | 0.476705 | 17.7426 |