| Red | Green | Blue | |
| z | 17.64 | ||
| znorm | Inf | ||
| sky | -Inf | -Inf | -NaN |
| S/N | 24.3 | 42.1 | 46.8 |
| S/N(c) | 0.0 | 0.0 | 0.0 |
| SN(E/C) |
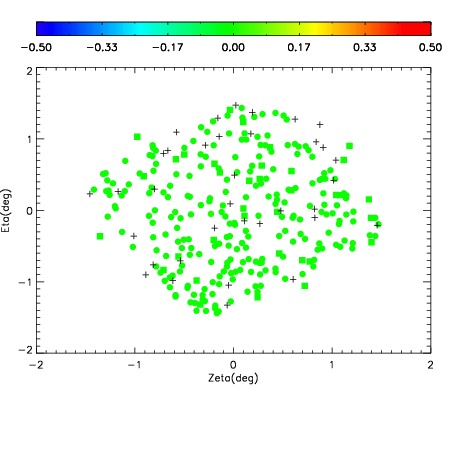
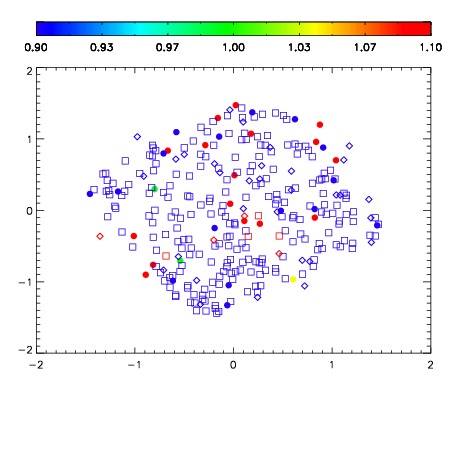
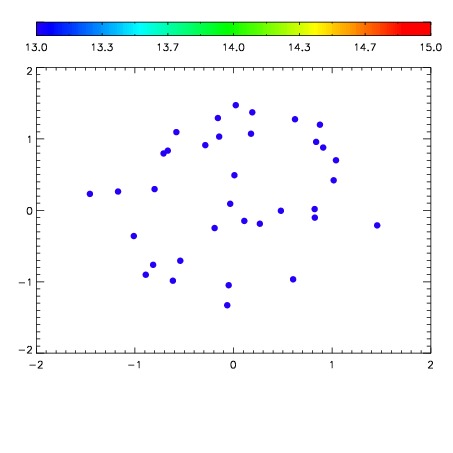

| Frame | Nreads | Zeropoints | Mag plots | Spatial mag deviation | Spatial sky 16325A emission deviations (filled: sky, open: star) | Spatial sky continuum emission | Spatial sky telluric CO2 absorption deviations (filled: H < 10) | |||||||||||||||||||||||
| 0 | 0 |
|
|
|
|
|
|
| IPAIR | NAME | SHIFT | NEWSHIFT | S/N | NAME | SHIFT | NEWSHIFT | S/N |
| 0 | 08510046 | 0.477861 | 0.00000 | 19.0817 | 08510047 | 0.00305846 | 0.474803 | 19.0844 |
| 1 | 08510042 | 0.477333 | 0.000527978 | 19.0584 | 08510044 | 0.00199106 | 0.475870 | 19.0457 |
| 2 | 08510045 | 0.475504 | 0.00235698 | 19.0365 | 08510043 | 0.00386682 | 0.473994 | 19.0011 |
| 3 | 08510041 | 0.475793 | 0.00206798 | 19.0089 | 08510040 | 0.00000 | 0.477861 | 18.9618 |