| Red | Green | Blue | |
| z | 17.64 | ||
| znorm | Inf | ||
| sky | -Inf | -NaN | -NaN |
| S/N | 31.7 | 49.1 | 57.6 |
| S/N(c) | 0.0 | 0.0 | 0.0 |
| SN(E/C) |
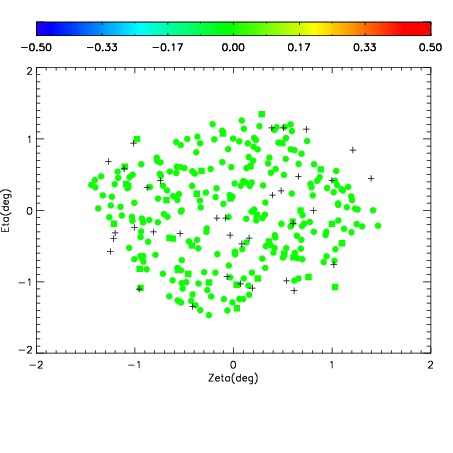
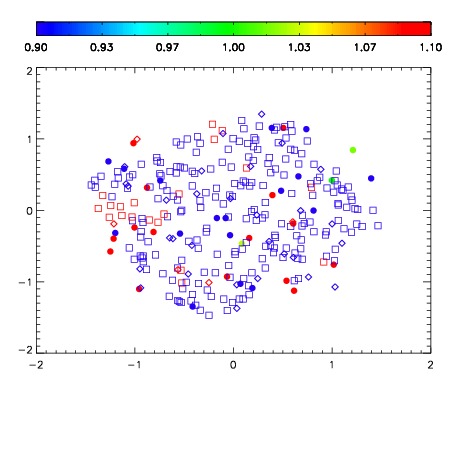


| Frame | Nreads | Zeropoints | Mag plots | Spatial mag deviation | Spatial sky 16325A emission deviations (filled: sky, open: star) | Spatial sky continuum emission | Spatial sky telluric CO2 absorption deviations (filled: H < 10) | |||||||||||||||||||||||
| 0 | 0 |
|
|
|
|
|
|
| IPAIR | NAME | SHIFT | NEWSHIFT | S/N | NAME | SHIFT | NEWSHIFT | S/N |
| 0 | 08780039 | 0.472162 | 0.00000 | 19.1354 | 08780037 | 0.00565443 | 0.466508 | 19.1144 |
| 1 | 08780040 | 0.471887 | 0.000275016 | 19.1431 | 08780041 | 0.00364335 | 0.468519 | 19.1333 |
| 2 | 08780036 | 0.472075 | 8.70228e-05 | 19.1142 | 08780038 | 0.00531747 | 0.466845 | 19.1078 |
| 3 | 08780035 | 0.471158 | 0.00100401 | 19.1016 | 08780034 | 0.00000 | 0.472162 | 19.0642 |