| Red | Green | Blue | |
| z | 17.64 | ||
| znorm | Inf | ||
| sky | -Inf | -Inf | -Inf |
| S/N | 23.9 | 35.0 | 37.5 |
| S/N(c) | 0.0 | 0.0 | 0.0 |
| SN(E/C) |
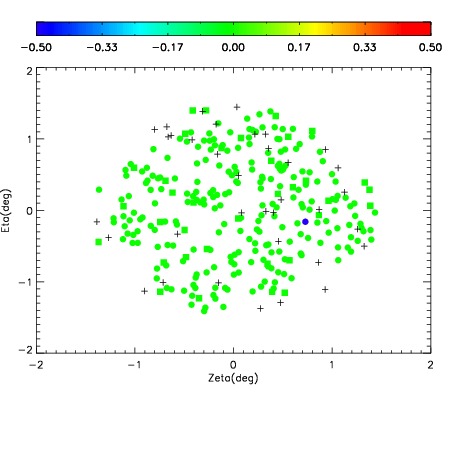
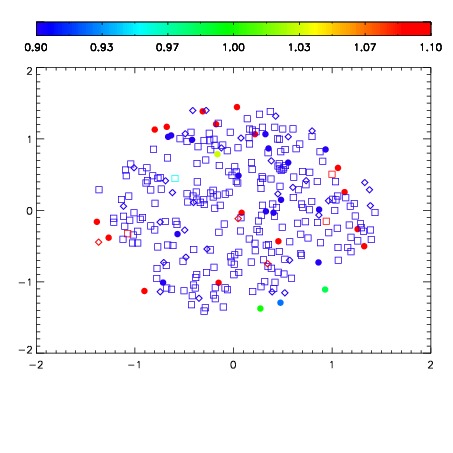
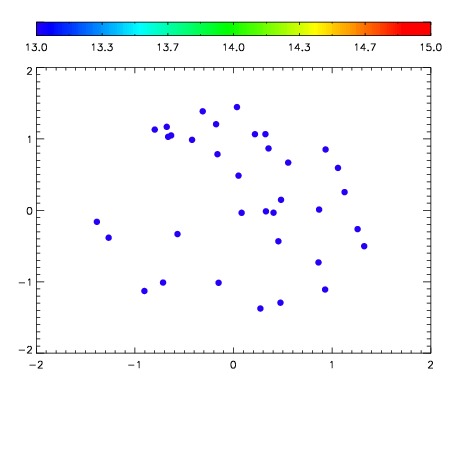

| Frame | Nreads | Zeropoints | Mag plots | Spatial mag deviation | Spatial sky 16325A emission deviations (filled: sky, open: star) | Spatial sky continuum emission | Spatial sky telluric CO2 absorption deviations (filled: H < 10) | |||||||||||||||||||||||
| 0 | 0 |
|
|
|
|
|
|
| IPAIR | NAME | SHIFT | NEWSHIFT | S/N | NAME | SHIFT | NEWSHIFT | S/N |
| 0 | 08980011 | 0.472416 | 0.00000 | 18.6728 | 08980014 | 0.0101611 | 0.462255 | 17.5141 |
| 1 | 08980015 | 0.466498 | 0.00591803 | 19.0047 | 08980010 | 0.00000 | 0.472416 | 18.9713 |
| 2 | 08980012 | 0.468797 | 0.00361902 | 19.0017 | 08980013 | 0.00681108 | 0.465605 | 18.4853 |