| Red | Green | Blue | |
| z | 17.64 | ||
| znorm | Inf | ||
| sky | -Inf | -Inf | -Inf |
| S/N | 35.4 | 52.8 | 57.6 |
| S/N(c) | 0.0 | 0.0 | 0.0 |
| SN(E/C) |
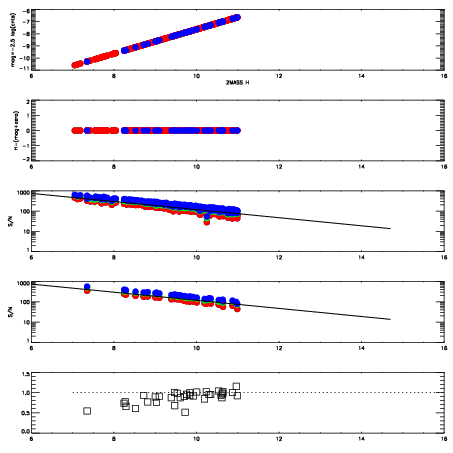
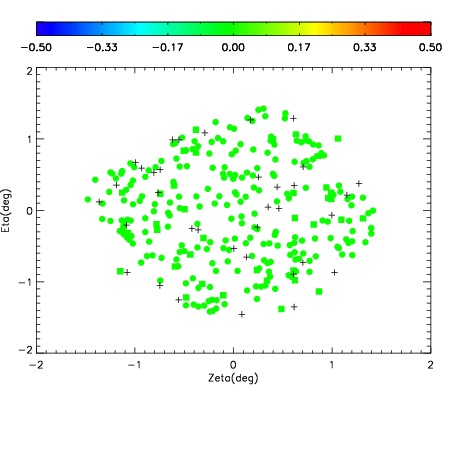
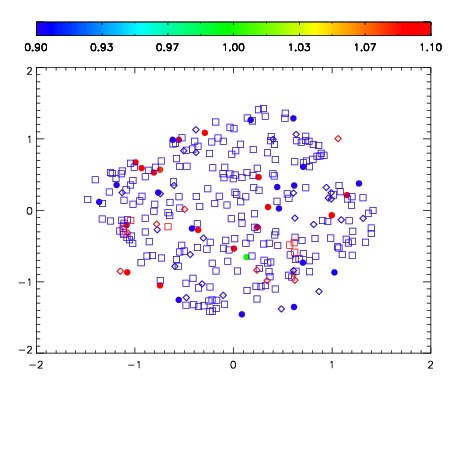


| Frame | Nreads | Zeropoints | Mag plots | Spatial mag deviation | Spatial sky 16325A emission deviations (filled: sky, open: star) | Spatial sky continuum emission | Spatial sky telluric CO2 absorption deviations (filled: H < 10) | |||||||||||||||||||||||
| 0 | 0 |
|
|
|
|
|
|
| IPAIR | NAME | SHIFT | NEWSHIFT | S/N | NAME | SHIFT | NEWSHIFT | S/N |
| 0 | 08210049 | 0.499186 | 0.00000 | 19.0882 | 08210048 | 0.00000 | 0.499186 | 19.0375 |
| 1 | 08210053 | 0.497556 | 0.00163001 | 19.1328 | 08210052 | -0.00440700 | 0.503593 | 19.1457 |
| 2 | 08210054 | 0.498014 | 0.00117201 | 19.1324 | 08210055 | -0.00403145 | 0.503217 | 19.1430 |
| 3 | 08210050 | 0.498899 | 0.000286996 | 19.1224 | 08210051 | -0.00432635 | 0.503512 | 19.1129 |