| Red | Green | Blue | |
| z | 17.63 | ||
| znorm | Inf | ||
| sky | -NaN | -NaN | -Inf |
| S/N | 22.7 | 35.3 | 34.5 |
| S/N(c) | 0.0 | 0.0 | 0.0 |
| SN(E/C) |
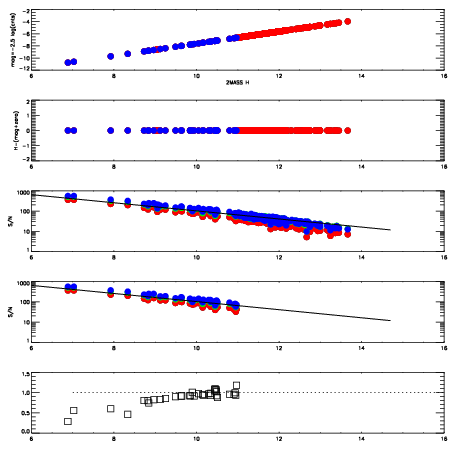
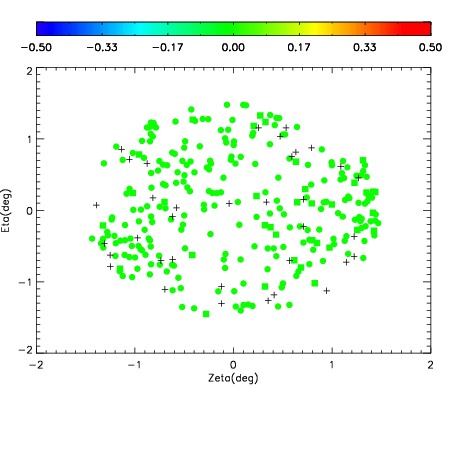
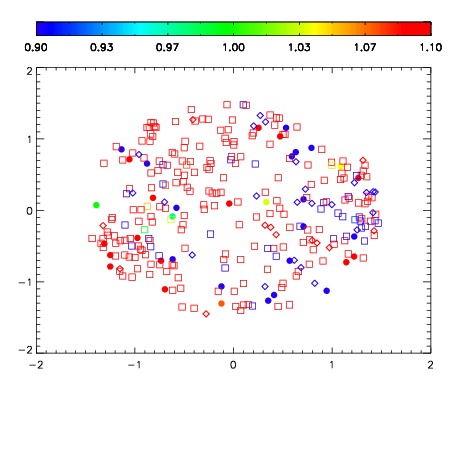
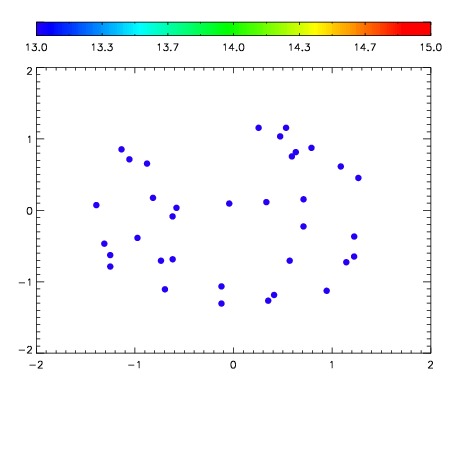

| Frame | Nreads | Zeropoints | Mag plots | Spatial mag deviation | Spatial sky 16325A emission deviations (filled: sky, open: star) | Spatial sky continuum emission | Spatial sky telluric CO2 absorption deviations (filled: H < 10) | |||||||||||||||||||||||
| 0 | 0 |
|
|
|
|
|
|
| IPAIR | NAME | SHIFT | NEWSHIFT | S/N | NAME | SHIFT | NEWSHIFT | S/N |
| 0 | 09060040 | 0.484255 | 0.00000 | 18.9205 | 09060038 | 0.00258682 | 0.481668 | 18.9491 |
| 1 | 09060037 | 0.479817 | 0.00443798 | 18.9143 | 09060035 | 0.00000 | 0.484255 | 18.9353 |
| 2 | 09060036 | 0.479801 | 0.00445399 | 18.9008 | 09060039 | 0.00298401 | 0.481271 | 18.9296 |