| Red | Green | Blue | |
| z | 17.63 | ||
| znorm | Inf | ||
| sky | -NaN | -NaN | -Inf |
| S/N | 23.6 | 37.6 | 37.7 |
| S/N(c) | 0.0 | 0.0 | 0.0 |
| SN(E/C) |
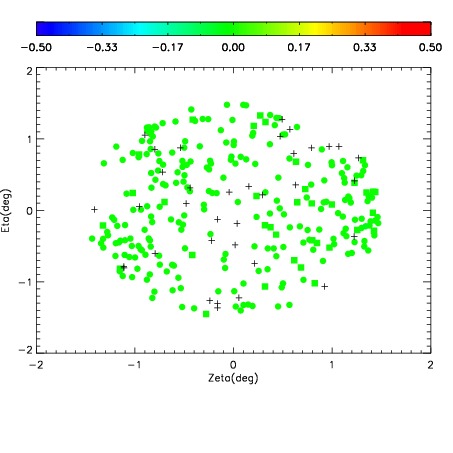

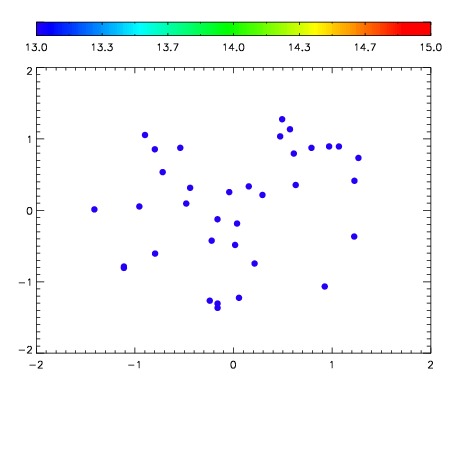

| Frame | Nreads | Zeropoints | Mag plots | Spatial mag deviation | Spatial sky 16325A emission deviations (filled: sky, open: star) | Spatial sky continuum emission | Spatial sky telluric CO2 absorption deviations (filled: H < 10) | |||||||||||||||||||||||
| 0 | 0 |
|
|
|
|
|
|
| IPAIR | NAME | SHIFT | NEWSHIFT | S/N | NAME | SHIFT | NEWSHIFT | S/N |
| 0 | 09780019 | 0.517434 | 0.00000 | 18.8877 | 09780021 | 0.00282035 | 0.514614 | 18.8218 |
| 1 | 09780020 | 0.517081 | 0.000352979 | 18.8671 | 09780014 | 0.00000 | 0.517434 | 18.8004 |
| 2 | 09780015 | 0.515315 | 0.00211900 | 18.7846 | 09780018 | 0.000320945 | 0.517113 | 18.7090 |
| 3 | 09780016 | 0.515222 | 0.00221199 | 18.6126 | 09780017 | -0.000617438 | 0.518051 | 18.5342 |