| Red | Green | Blue | |
| z | 17.64 | ||
| znorm | Inf | ||
| sky | -Inf | -Inf | -NaN |
| S/N | 26.2 | 44.3 | 47.0 |
| S/N(c) | 0.0 | 0.0 | 0.0 |
| SN(E/C) |
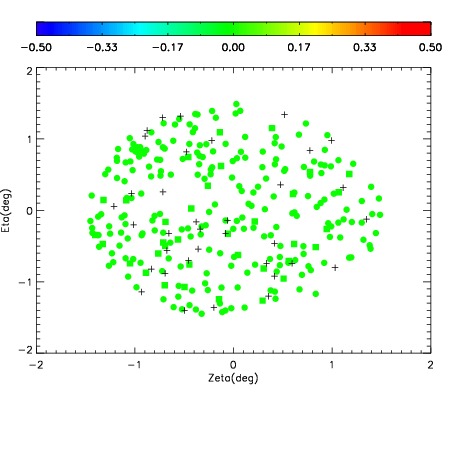
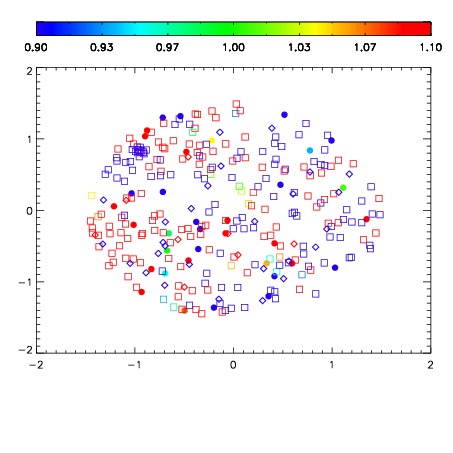
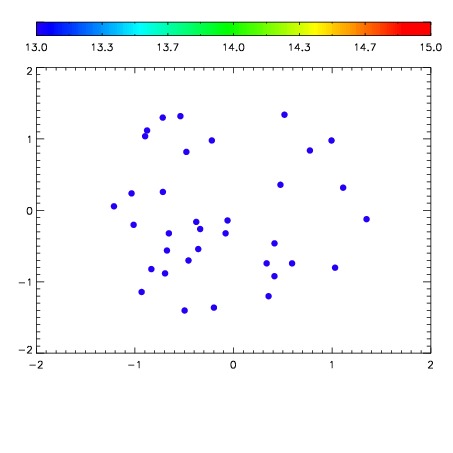

| Frame | Nreads | Zeropoints | Mag plots | Spatial mag deviation | Spatial sky 16325A emission deviations (filled: sky, open: star) | Spatial sky continuum emission | Spatial sky telluric CO2 absorption deviations (filled: H < 10) | |||||||||||||||||||||||
| 0 | 0 |
|
|
|
|
|
|
| IPAIR | NAME | SHIFT | NEWSHIFT | S/N | NAME | SHIFT | NEWSHIFT | S/N |
| 0 | 08660017 | 0.490192 | 0.00000 | 18.9759 | 08660018 | 0.00604566 | 0.484146 | 18.8481 |
| 1 | 08660013 | 0.489134 | 0.00105798 | 19.0238 | 08660014 | 0.00341198 | 0.486780 | 19.0243 |
| 2 | 08660012 | 0.489319 | 0.000872999 | 19.0112 | 08660015 | 0.00397911 | 0.486213 | 18.9837 |
| 3 | 08660016 | 0.488812 | 0.00138000 | 19.0054 | 08660011 | 0.00000 | 0.490192 | 18.9781 |