| Red | Green | Blue | |
| z | 17.64 | ||
| znorm | Inf | ||
| sky | -Inf | -Inf | -Inf |
| S/N | 11.5 | 20.2 | 22.8 |
| S/N(c) | 0.0 | 0.0 | 0.0 |
| SN(E/C) |
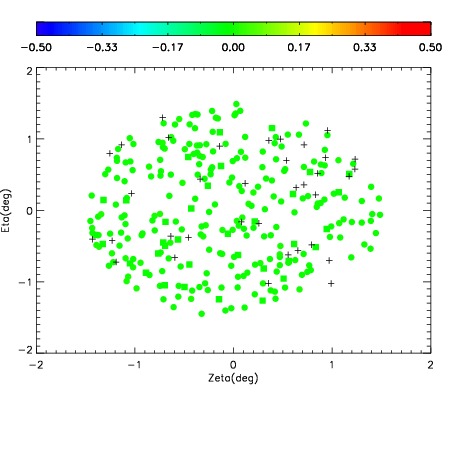
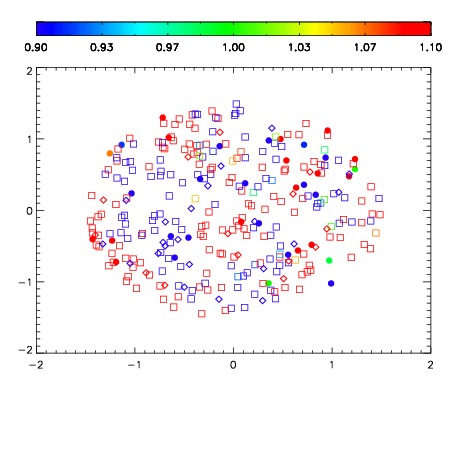
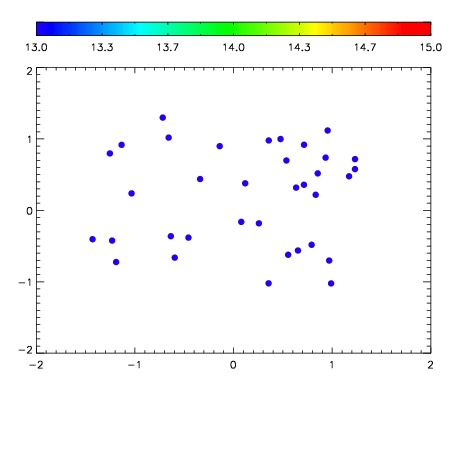

| Frame | Nreads | Zeropoints | Mag plots | Spatial mag deviation | Spatial sky 16325A emission deviations (filled: sky, open: star) | Spatial sky continuum emission | Spatial sky telluric CO2 absorption deviations (filled: H < 10) | |||||||||||||||||||||||
| 0 | 0 |
|
|
|
|
|
|
| IPAIR | NAME | SHIFT | NEWSHIFT | S/N | NAME | SHIFT | NEWSHIFT | S/N |
| 0 | 12030083 | 0.504015 | 0.00000 | 17.4187 | 12030084 | 0.00166881 | 0.502346 | 17.5824 |
| 1 | 12030087 | 0.501140 | 0.00287503 | 18.3788 | 12030088 | 0.000331445 | 0.503684 | 18.4351 |
| 2 | 12030086 | 0.500449 | 0.00356603 | 18.1995 | 12030085 | 0.00130690 | 0.502708 | 17.9294 |
| 3 | 12030082 | 0.502233 | 0.00178200 | 16.8704 | 12030081 | 0.00000 | 0.504015 | 17.4322 |