| Red | Green | Blue | |
| z | 17.64 | ||
| znorm | Inf | ||
| sky | -Inf | -NaN | -NaN |
| S/N | 21.6 | 37.5 | 39.3 |
| S/N(c) | 0.0 | 0.0 | 0.0 |
| SN(E/C) |
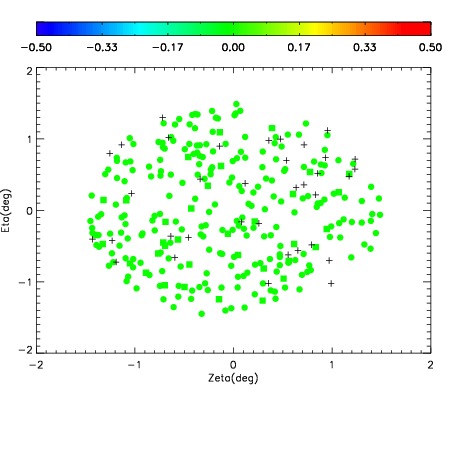
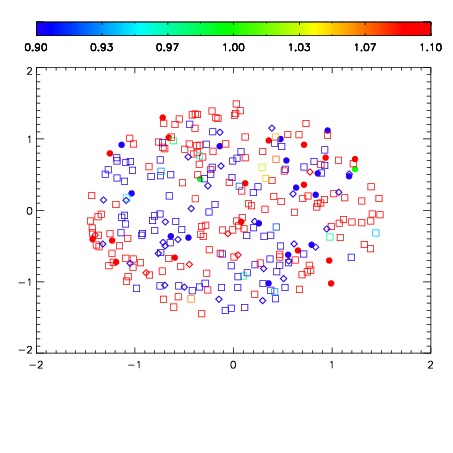
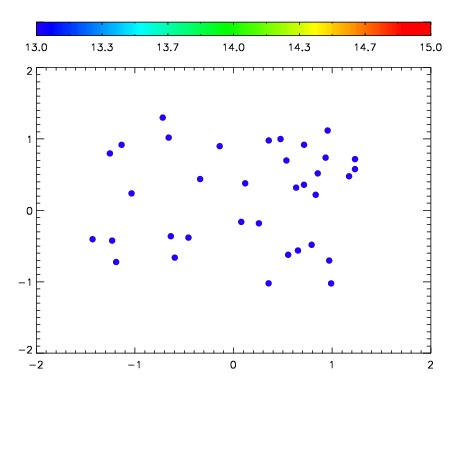

| Frame | Nreads | Zeropoints | Mag plots | Spatial mag deviation | Spatial sky 16325A emission deviations (filled: sky, open: star) | Spatial sky continuum emission | Spatial sky telluric CO2 absorption deviations (filled: H < 10) | |||||||||||||||||||||||
| 0 | 0 |
|
|
|
|
|
|
| IPAIR | NAME | SHIFT | NEWSHIFT | S/N | NAME | SHIFT | NEWSHIFT | S/N |
| 0 | 12080028 | 0.495360 | 0.00000 | 18.6560 | 12080025 | 0.00290939 | 0.492451 | 18.5858 |
| 1 | 12080023 | 0.493625 | 0.00173500 | 18.8354 | 12080022 | 0.00000 | 0.495360 | 18.8753 |
| 2 | 12080024 | 0.494692 | 0.000667989 | 18.8003 | 12080026 | 0.00168147 | 0.493679 | 18.6227 |
| 3 | 12080027 | 0.494756 | 0.000603974 | 18.5980 | 12080029 | 0.000518466 | 0.494842 | 18.2963 |