| Red | Green | Blue | |
| z | 17.64 | ||
| znorm | Inf | ||
| sky | -NaN | -Inf | -Inf |
| S/N | 31.3 | 52.2 | 55.5 |
| S/N(c) | 0.0 | 0.0 | 0.0 |
| SN(E/C) |
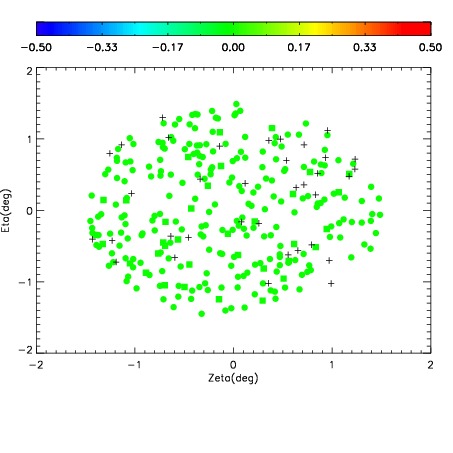
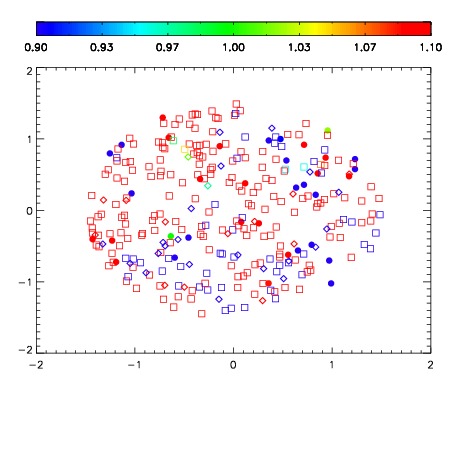
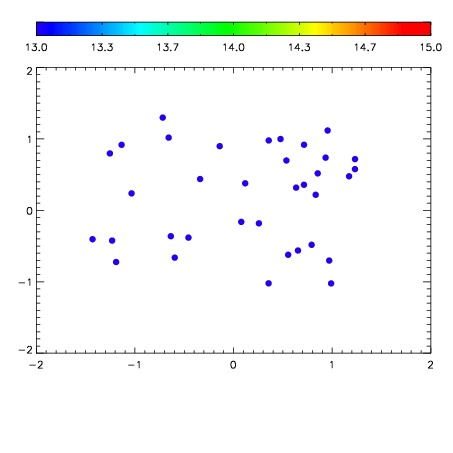

| Frame | Nreads | Zeropoints | Mag plots | Spatial mag deviation | Spatial sky 16325A emission deviations (filled: sky, open: star) | Spatial sky continuum emission | Spatial sky telluric CO2 absorption deviations (filled: H < 10) | |||||||||||||||||||||||
| 0 | 0 |
|
|
|
|
|
|
| IPAIR | NAME | SHIFT | NEWSHIFT | S/N | NAME | SHIFT | NEWSHIFT | S/N |
| 0 | 12400043 | 0.497419 | 0.00000 | 19.1226 | 12400044 | 0.00180179 | 0.495617 | 19.1067 |
| 1 | 12400046 | 0.496425 | 0.000993997 | 19.1568 | 12400045 | 0.00108295 | 0.496336 | 19.1347 |
| 2 | 12400042 | 0.497210 | 0.000209004 | 19.0639 | 12400041 | 0.00127371 | 0.496145 | 19.0924 |
| 3 | 12400039 | 0.495633 | 0.00178599 | 19.0544 | 12400040 | 0.00120152 | 0.496217 | 19.0629 |
| 4 | 12400038 | 0.495495 | 0.00192401 | 19.0517 | 12400037 | 0.00000 | 0.497419 | 18.9885 |