| Red | Green | Blue | |
| z | 17.64 | ||
| znorm | Inf | ||
| sky | -NaN | -Inf | -Inf |
| S/N | 25.6 | 41.3 | 41.9 |
| S/N(c) | 0.0 | 0.0 | 0.0 |
| SN(E/C) |
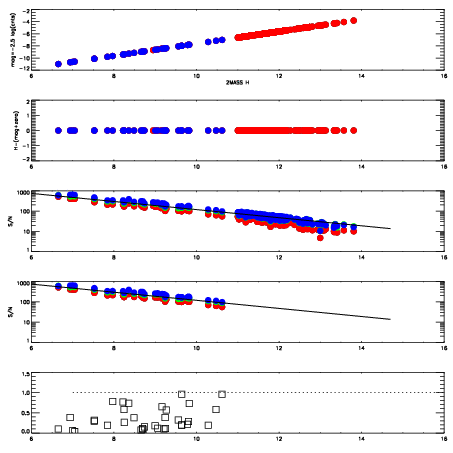
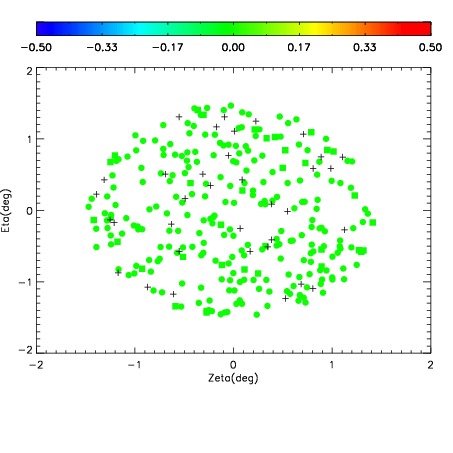
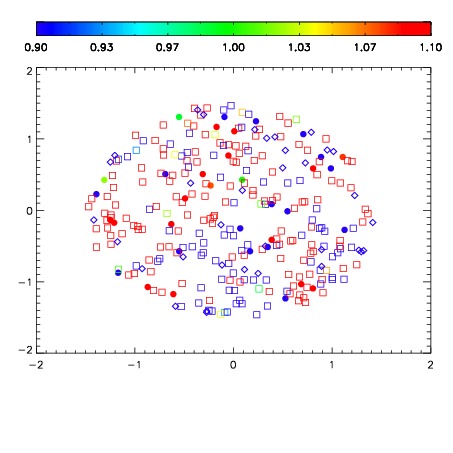


| Frame | Nreads | Zeropoints | Mag plots | Spatial mag deviation | Spatial sky 16325A emission deviations (filled: sky, open: star) | Spatial sky continuum emission | Spatial sky telluric CO2 absorption deviations (filled: H < 10) | |||||||||||||||||||||||
| 0 | 0 |
|
|
|
|
|
|
| IPAIR | NAME | SHIFT | NEWSHIFT | S/N | NAME | SHIFT | NEWSHIFT | S/N |
| 0 | 12200035 | 0.502947 | 0.00000 | 18.9845 | 12200040 | -0.000394586 | 0.503342 | 18.9844 |
| 1 | 12200038 | 0.502486 | 0.000460982 | 19.0341 | 12200037 | 0.00145238 | 0.501495 | 19.0351 |
| 2 | 12200039 | 0.502385 | 0.000561953 | 19.0271 | 12200036 | 0.00130408 | 0.501643 | 18.9933 |
| 3 | 12200034 | 0.501976 | 0.000970960 | 18.8043 | 12200033 | 0.00000 | 0.502947 | 18.7402 |