| Red | Green | Blue | |
| z | 17.64 | ||
| znorm | Inf | ||
| sky | -NaN | -Inf | -Inf |
| S/N | 28.0 | 44.1 | 44.7 |
| S/N(c) | 0.0 | 0.0 | 0.0 |
| SN(E/C) |
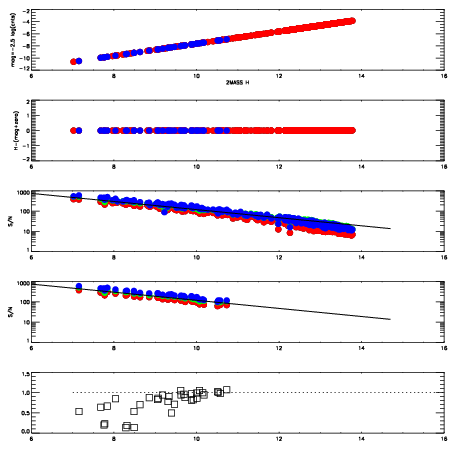


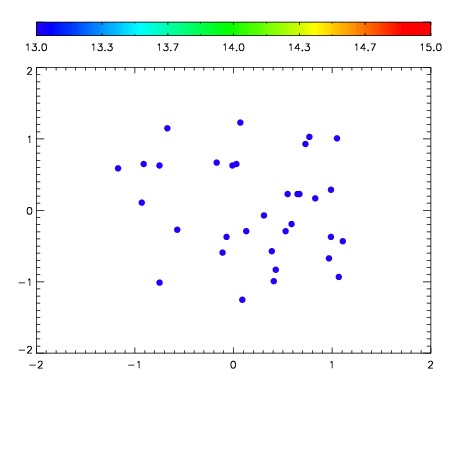

| Frame | Nreads | Zeropoints | Mag plots | Spatial mag deviation | Spatial sky 16325A emission deviations (filled: sky, open: star) | Spatial sky continuum emission | Spatial sky telluric CO2 absorption deviations (filled: H < 10) | |||||||||||||||||||||||
| 0 | 0 |
|
|
|
|
|
|
| IPAIR | NAME | SHIFT | NEWSHIFT | S/N | NAME | SHIFT | NEWSHIFT | S/N |
| 0 | 12250065 | 0.500668 | 0.00000 | 18.9910 | 12250066 | -0.000198093 | 0.500866 | 19.0061 |
| 1 | 12250061 | 0.496150 | 0.00451800 | 18.9844 | 12250062 | 0.000230199 | 0.500438 | 18.9332 |
| 2 | 12250064 | 0.500493 | 0.000174999 | 18.9168 | 12250063 | 0.00101667 | 0.499651 | 18.9329 |
| 3 | 12250060 | 0.494671 | 0.00599700 | 18.8674 | 12250059 | 0.00000 | 0.500668 | 18.7676 |