| Red | Green | Blue | |
| z | 17.64 | ||
| znorm | Inf | ||
| sky | -Inf | -Inf | -Inf |
| S/N | 25.2 | 41.4 | 40.5 |
| S/N(c) | 0.0 | 0.0 | 0.0 |
| SN(E/C) |


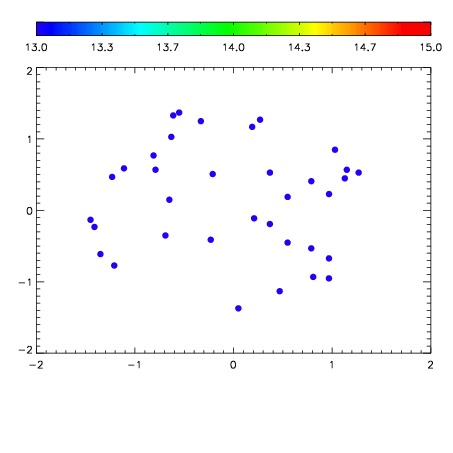

| Frame | Nreads | Zeropoints | Mag plots | Spatial mag deviation | Spatial sky 16325A emission deviations (filled: sky, open: star) | Spatial sky continuum emission | Spatial sky telluric CO2 absorption deviations (filled: H < 10) | |||||||||||||||||||||||
| 0 | 0 |
|
|
|
|
|
|
| IPAIR | NAME | SHIFT | NEWSHIFT | S/N | NAME | SHIFT | NEWSHIFT | S/N |
| 0 | 12480017 | 0.498616 | 0.00000 | 18.9198 | 12480015 | -0.00101649 | 0.499633 | 18.9432 |
| 1 | 12480016 | 0.498563 | 5.30183e-05 | 18.9451 | 12480018 | -0.000772375 | 0.499388 | 18.9908 |
| 2 | 12480012 | 0.494774 | 0.00384200 | 18.8886 | 12480014 | -0.00158917 | 0.500205 | 18.9201 |
| 3 | 12480013 | 0.495270 | 0.00334600 | 18.8684 | 12480011 | 0.00000 | 0.498616 | 18.7876 |