| Red | Green | Blue | |
| z | 17.64 | ||
| znorm | Inf | ||
| sky | -NaN | -Inf | -NaN |
| S/N | 26.6 | 41.6 | 41.1 |
| S/N(c) | 0.0 | 0.0 | 0.0 |
| SN(E/C) |
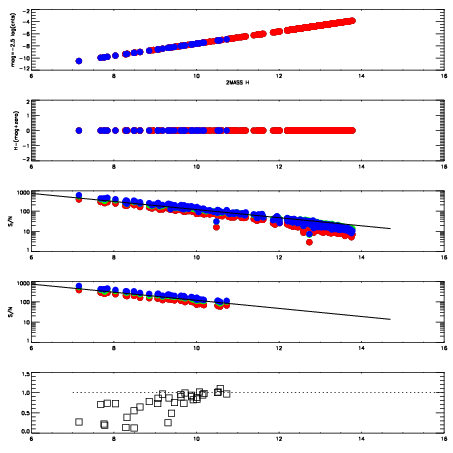
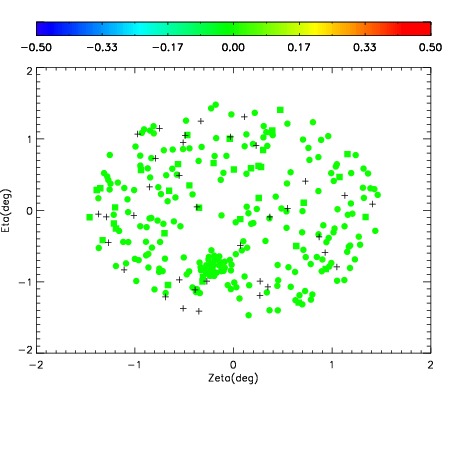
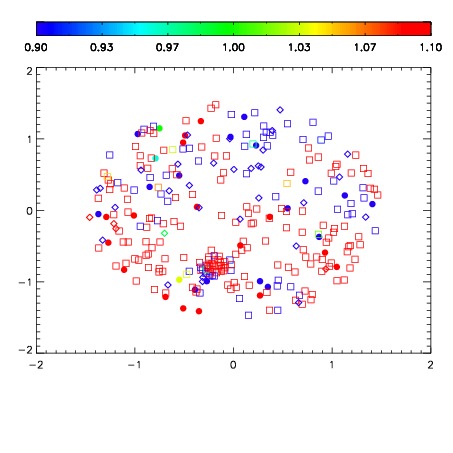


| Frame | Nreads | Zeropoints | Mag plots | Spatial mag deviation | Spatial sky 16325A emission deviations (filled: sky, open: star) | Spatial sky continuum emission | Spatial sky telluric CO2 absorption deviations (filled: H < 10) | |||||||||||||||||||||||
| 0 | 0 |
|
|
|
|
|
|
| IPAIR | NAME | SHIFT | NEWSHIFT | S/N | NAME | SHIFT | NEWSHIFT | S/N |
| 0 | 12230043 | 0.494134 | 0.00000 | 18.8821 | 12230044 | -0.00193984 | 0.496074 | 18.8790 |
| 1 | 12230042 | 0.493363 | 0.000771016 | 18.8762 | 12230040 | -0.00306588 | 0.497200 | 18.8587 |
| 2 | 12230039 | 0.494074 | 6.00219e-05 | 18.8358 | 12230041 | -0.00290375 | 0.497038 | 18.8488 |
| 3 | 12230038 | 0.493836 | 0.000298023 | 18.8286 | 12230037 | 0.00000 | 0.494134 | 18.6555 |