| Red | Green | Blue | |
| z | 17.64 | ||
| znorm | Inf | ||
| sky | -NaN | -Inf | -Inf |
| S/N | 22.5 | 32.2 | 28.0 |
| S/N(c) | 0.0 | 0.0 | 0.0 |
| SN(E/C) |
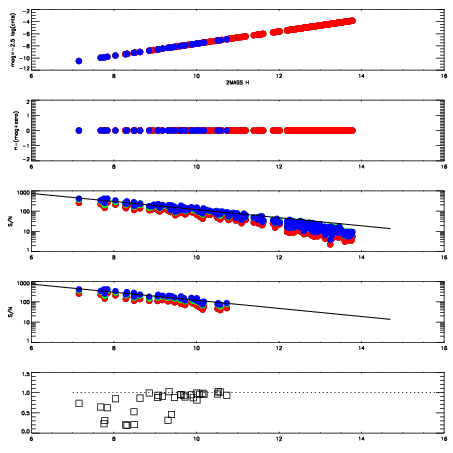

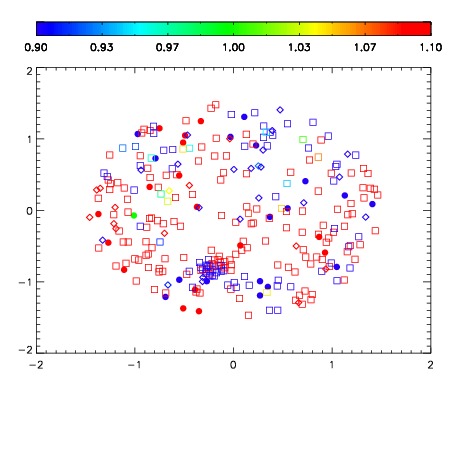
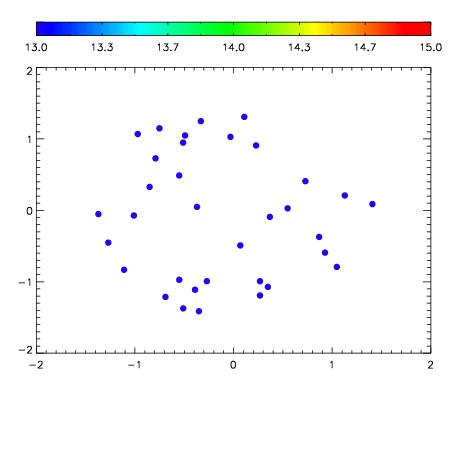

| Frame | Nreads | Zeropoints | Mag plots | Spatial mag deviation | Spatial sky 16325A emission deviations (filled: sky, open: star) | Spatial sky continuum emission | Spatial sky telluric CO2 absorption deviations (filled: H < 10) | |||||||||||||||||||||||
| 0 | 0 |
|
|
|
|
|
|
| IPAIR | NAME | SHIFT | NEWSHIFT | S/N | NAME | SHIFT | NEWSHIFT | S/N |
| 0 | 12310045 | 0.493064 | 0.00000 | 18.1342 | 12310047 | -0.00173345 | 0.494797 | 18.2933 |
| 1 | 12310050 | 0.491986 | 0.00107798 | 18.8536 | 12310051 | -0.00398513 | 0.497049 | 18.8586 |
| 2 | 12310049 | 0.491643 | 0.00142097 | 18.7587 | 12310048 | -0.00195756 | 0.495022 | 18.5532 |
| 3 | 12310046 | 0.492477 | 0.000586987 | 18.0775 | 12310044 | 0.00000 | 0.493064 | 17.9149 |