| Red | Green | Blue | |
| z | 17.64 | ||
| znorm | Inf | ||
| sky | -Inf | -NaN | -NaN |
| S/N | 28.3 | 40.7 | 37.6 |
| S/N(c) | 0.0 | 0.0 | 0.0 |
| SN(E/C) |

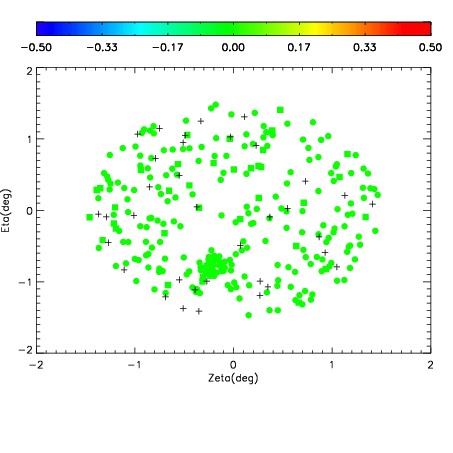
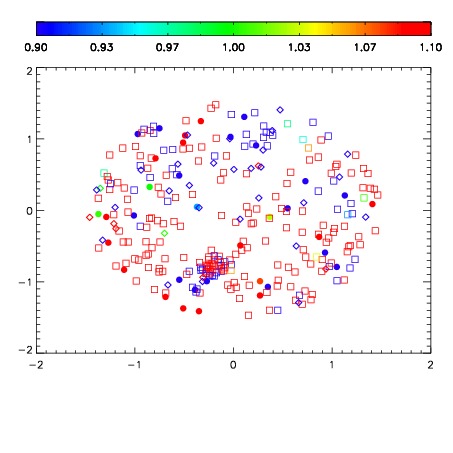
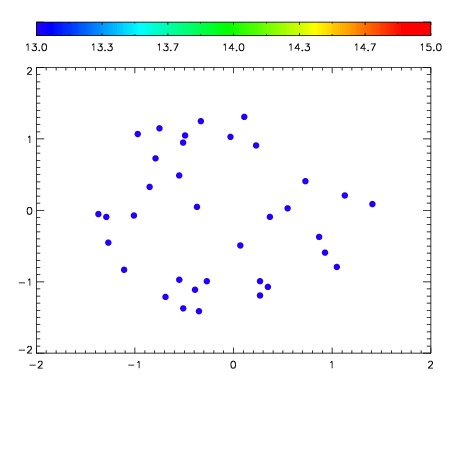

| Frame | Nreads | Zeropoints | Mag plots | Spatial mag deviation | Spatial sky 16325A emission deviations (filled: sky, open: star) | Spatial sky continuum emission | Spatial sky telluric CO2 absorption deviations (filled: H < 10) | |||||||||||||||||||||||
| 0 | 0 |
|
|
|
|
|
|
| IPAIR | NAME | SHIFT | NEWSHIFT | S/N | NAME | SHIFT | NEWSHIFT | S/N |
| 0 | 12370027 | 0.491923 | 0.00000 | 18.4764 | 12370026 | 0.00258237 | 0.489341 | 18.4519 |
| 1 | 12370028 | 0.491612 | 0.000311017 | 18.9994 | 12370022 | 0.00000 | 0.491923 | 18.9832 |
| 2 | 12370023 | 0.488897 | 0.00302601 | 18.8969 | 12370029 | 0.00209520 | 0.489828 | 18.9244 |
| 3 | 12370024 | 0.489962 | 0.00196099 | 18.7497 | 12370025 | 0.00228063 | 0.489642 | 18.6776 |