| Red | Green | Blue | |
| z | 17.64 | ||
| znorm | Inf | ||
| sky | -NaN | -NaN | -Inf |
| S/N | 21.8 | 32.8 | 35.5 |
| S/N(c) | 0.0 | 0.0 | 0.0 |
| SN(E/C) |

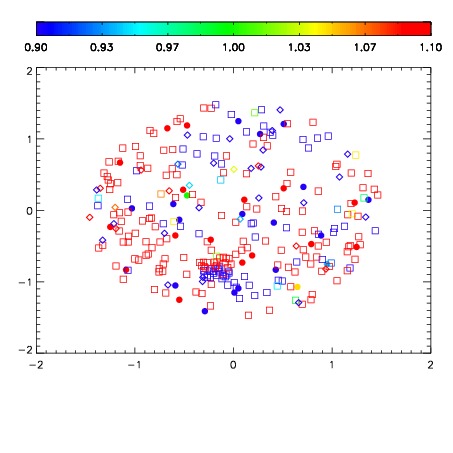
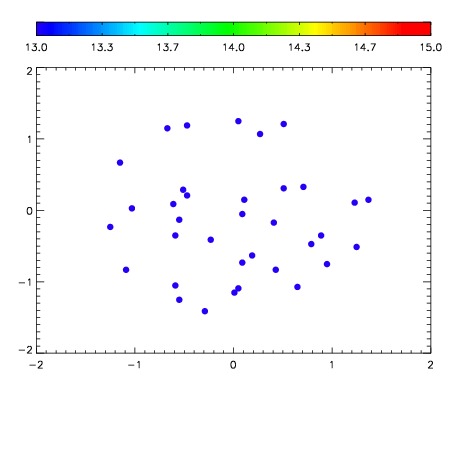

| Frame | Nreads | Zeropoints | Mag plots | Spatial mag deviation | Spatial sky 16325A emission deviations (filled: sky, open: star) | Spatial sky continuum emission | Spatial sky telluric CO2 absorption deviations (filled: H < 10) | |||||||||||||||||||||||
| 0 | 0 |
|
|
|
|
|
|
| IPAIR | NAME | SHIFT | NEWSHIFT | S/N | NAME | SHIFT | NEWSHIFT | S/N |
| 0 | 12240061 | 0.495672 | 0.00000 | 18.8033 | 12240062 | 0.00277731 | 0.492895 | 18.8004 |
| 1 | 12240057 | 0.493158 | 0.00251397 | 18.7574 | 12240058 | 0.000196894 | 0.495475 | 18.7930 |
| 2 | 12240056 | 0.492099 | 0.00357300 | 18.6704 | 12240055 | 0.00000 | 0.495672 | 18.5450 |
| 3 | 12240060 | 0.495445 | 0.000226974 | 18.5779 | 12240059 | 0.00110684 | 0.494565 | 18.5330 |